Introduction
LocalStack offers a rich cloud development framework to emulate the functionality of many AWS services locally at a fraction of the cost and effort. It supports developers with facilities to build, test and launch complex applications locally, including services such as the Amazon Neptune.
However, interacting with Amazon Neptune can be challenging due to the lack of easy-to-use tools, as well as the learning curve associated with graph databases and their querying languages. We’re excited to announce our partnership with G.V() to bring you a first-class graph database development experience fully compatible with LocalStack and Amazon Neptune.
What is G.V()?
G.V() is a Gremlin Integrated Development Environment (IDE for short) specially designed for Apache TinkerPop Graph Databases systems such as Amazon Neptune, Aerospike Graph and JanusGraph.
It’s an easy-to-install desktop application compatible with Windows, macOS and Linux. It provides many features to assist with day-to-day development and production usage of graph databases, including:
- Querying the graph database using Gremlin via a powerful smart editor offering code completion and embedded documentation for the Gremlin language and your data model.
- Automatic discovery of your Graph data schema with visualization and documentation features.
- Debugging Gremlin queries step-by-step and at an individual traversal level.
- Exploring graph data interactively in a low-code fashion.
- Multiple customisable results visualization and navigation formats such as Graphs, Tables and JSON.
- Support for all major Apache TinkerPop Graph Database systems and the ability to manage many different database connections in a single user interface.
With G.V(), developers and data analysts can drastically accelerate their graph database adoption and analyse their existing graph data effortlessly thanks to its data explorer, AI integration, graph visualisation capabilities and smart query editor.
Configuring a LocalStack Neptune database connection on G.V()
A database connection in G.V() allows you to execute Gremlin queries, view your graph data schema, explore your data interactively and much more. To get started you’ll first need to install G.V(). You’ll also need to have LocalStack running with at least one Neptune instance created and its port number (follow our documentation to get started).
Installing G.V()
To install G.V(), head over to the G.V() website and download the right executable for your operating system (Windows/macOS/Linux). Run the installer and follow the on-screen instructions, and you’ll be ready in just a few clicks.
Connecting G.V() to your LocalStack Neptune Database
On G.V(), click on Add New Database Connection. Select LocalStack as the Graph Technology Type.
Enter localhost.localstack.cloud as the hostname and the port number returned when creating your Neptune instance using the AWS CLI, then click on Test Connection. G.V() will ensure it can connect to your LocalStack Neptune Database as expected.
Once that’s confirmed, you’ll see a message indicating your connection is ready, simply click on Submit.
A new query tab will open where you’ll be prompted to sign up for a free 2-week trial of G.V() if you haven’t done so already — it takes just a minute and then you’ll be all set!
Loading sample data to your LocalStack Neptune Database
If you haven’t got any data in your LocalStack Neptune instance yet, let’s load some. Simply run the following script to import a small graph and visualise it:
g.addV('person').as('38a15c92-5e45-4d13-9c96-1dc4582e223d'). property(single, 'age', 29). property(single, 'name', "marko"). addV('software').as('b70c011a-6908-4ba6-ba09-3cf497a7200e'). property(single, 'lang', "java"). property(single, 'name', "lop"). addV('person').as('83b6b6eb-6dd5-43cd-9868-9b2dca746011'). property(single, 'age', 35). property(single, 'name', "peter"). addV('person').as('aee846b6-c69b-4453-83ef-3d418cc84788'). property(single, 'age', 32). property(single, 'name', "josh"). addV('software').as('1b42b83e-a0df-4687-a92b-22defdf4ae30'). property(single, 'lang', "java"). property(single, 'name', "ripple"). addV('person').as('603fe545-1b65-4ece-9f4a-e66005a30c3c'). property(single, 'age', 27). property(single, 'name', "vadas"). addE('created'). from('38a15c92-5e45-4d13-9c96-1dc4582e223d'). to('b70c011a-6908-4ba6-ba09-3cf497a7200e'). aggregate('t'). property('weight', 0.4). addE('created'). from('83b6b6eb-6dd5-43cd-9868-9b2dca746011'). to('b70c011a-6908-4ba6-ba09-3cf497a7200e'). aggregate('t'). property('weight', 0.2). addE('created'). from('aee846b6-c69b-4453-83ef-3d418cc84788'). to('1b42b83e-a0df-4687-a92b-22defdf4ae30'). aggregate('t'). property('weight', 1). addE('knows'). from('38a15c92-5e45-4d13-9c96-1dc4582e223d'). to('603fe545-1b65-4ece-9f4a-e66005a30c3c'). aggregate('t'). property('weight', 0.5). addE('created'). from('aee846b6-c69b-4453-83ef-3d418cc84788'). to('b70c011a-6908-4ba6-ba09-3cf497a7200e'). aggregate('t'). property('weight', 0.4). addE('knows'). from('38a15c92-5e45-4d13-9c96-1dc4582e223d'). to('aee846b6-c69b-4453-83ef-3d418cc84788'). aggregate('t'). property('weight', 1). select('t')Run the query by clicking on the green play button, and you should see the graph output shown below:
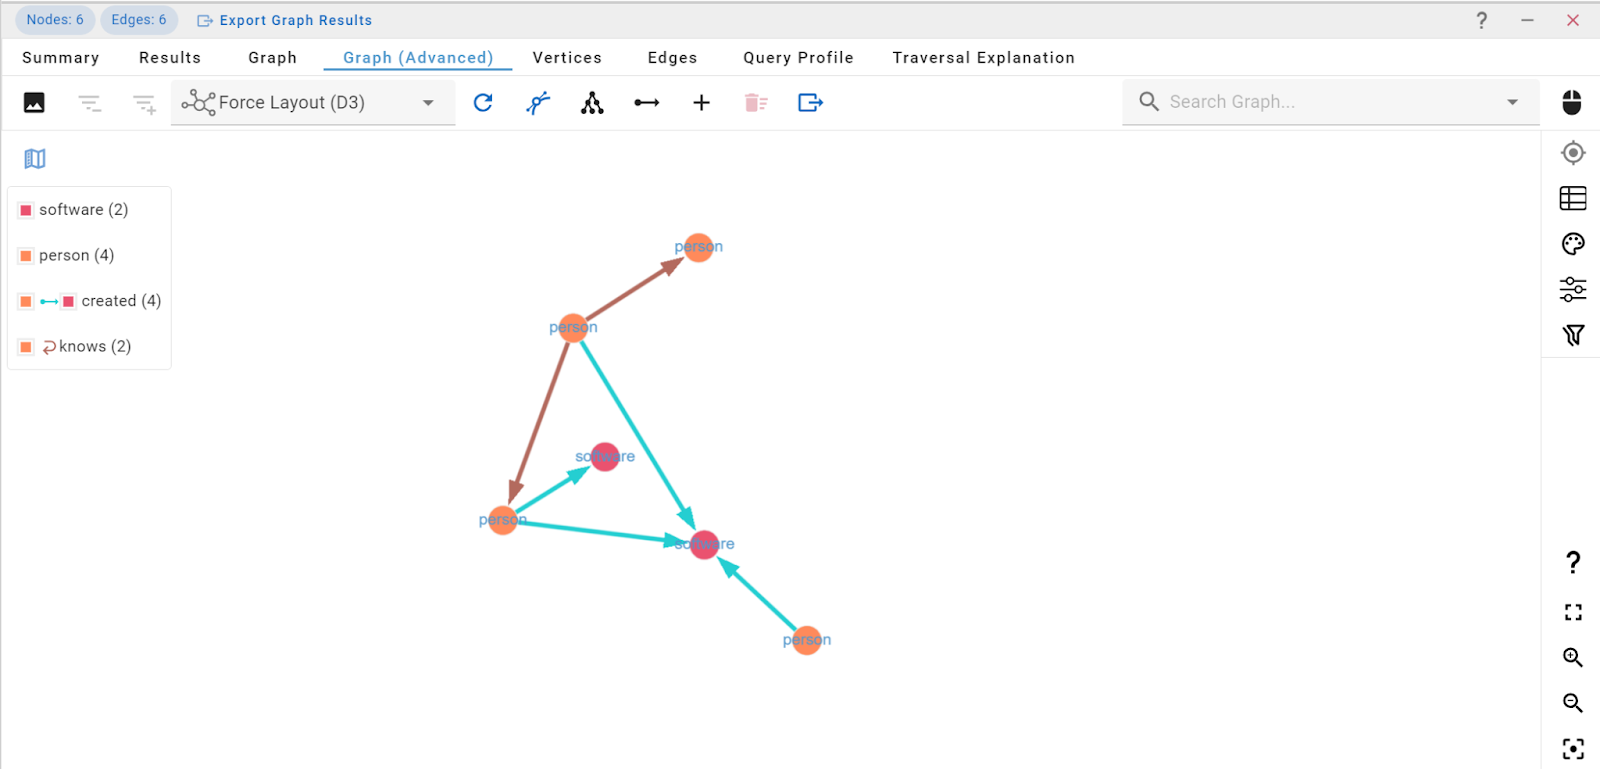
Feel free to have a play around the graph visualisation and the various tools available — once you’re done, we’ll check the Graph Data Schema.
Viewing the Graph Data Schema
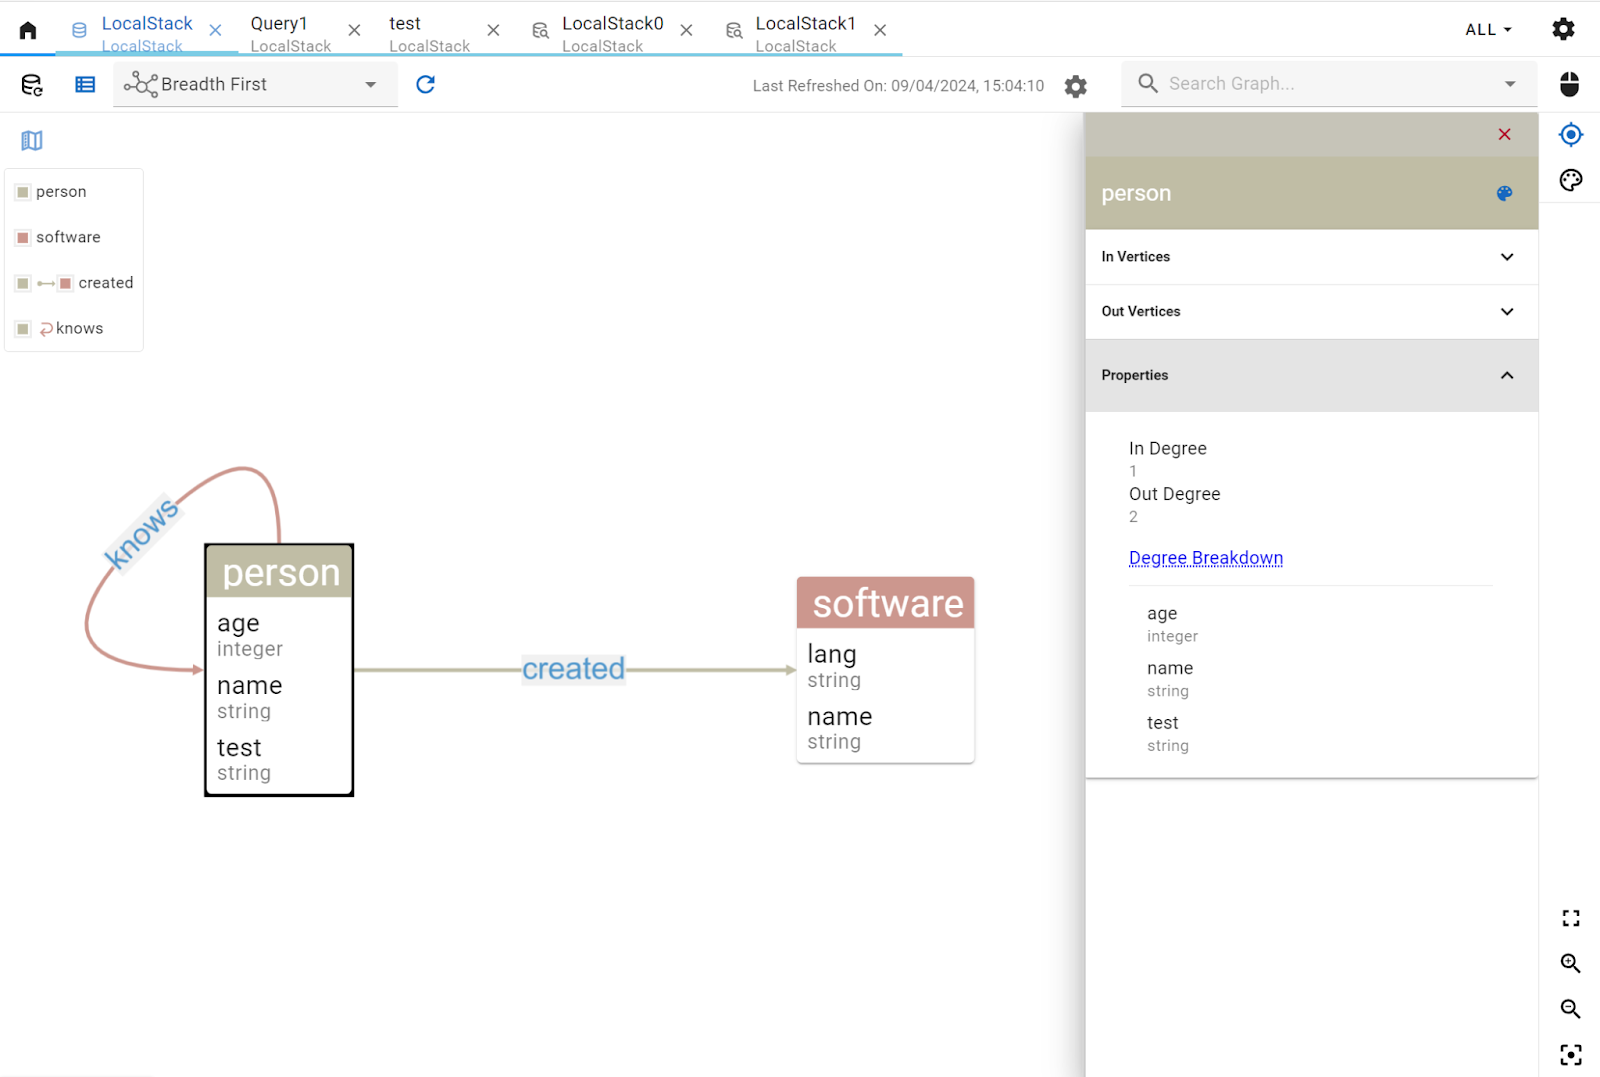
G.V() automatically detects the structure of your graph database to power many of its features. It can also display it directly to you for reference — this is a great way of checking how the vertices and edges are defined in your graph.
In the Connections sidebar, under your LocalStack connection, simply click on View Graph Data Model.
For the above sample data, you’ll see the graph data schema below — it’s all generated automatically by G.V():
Exploring the Graph Data interactively
You don’t always need to write a Gremlin query to explore your data — you can simply use G.V()’s Graph Data Explorer. You can design your query with a few quick filters and get straight to visualising your data.
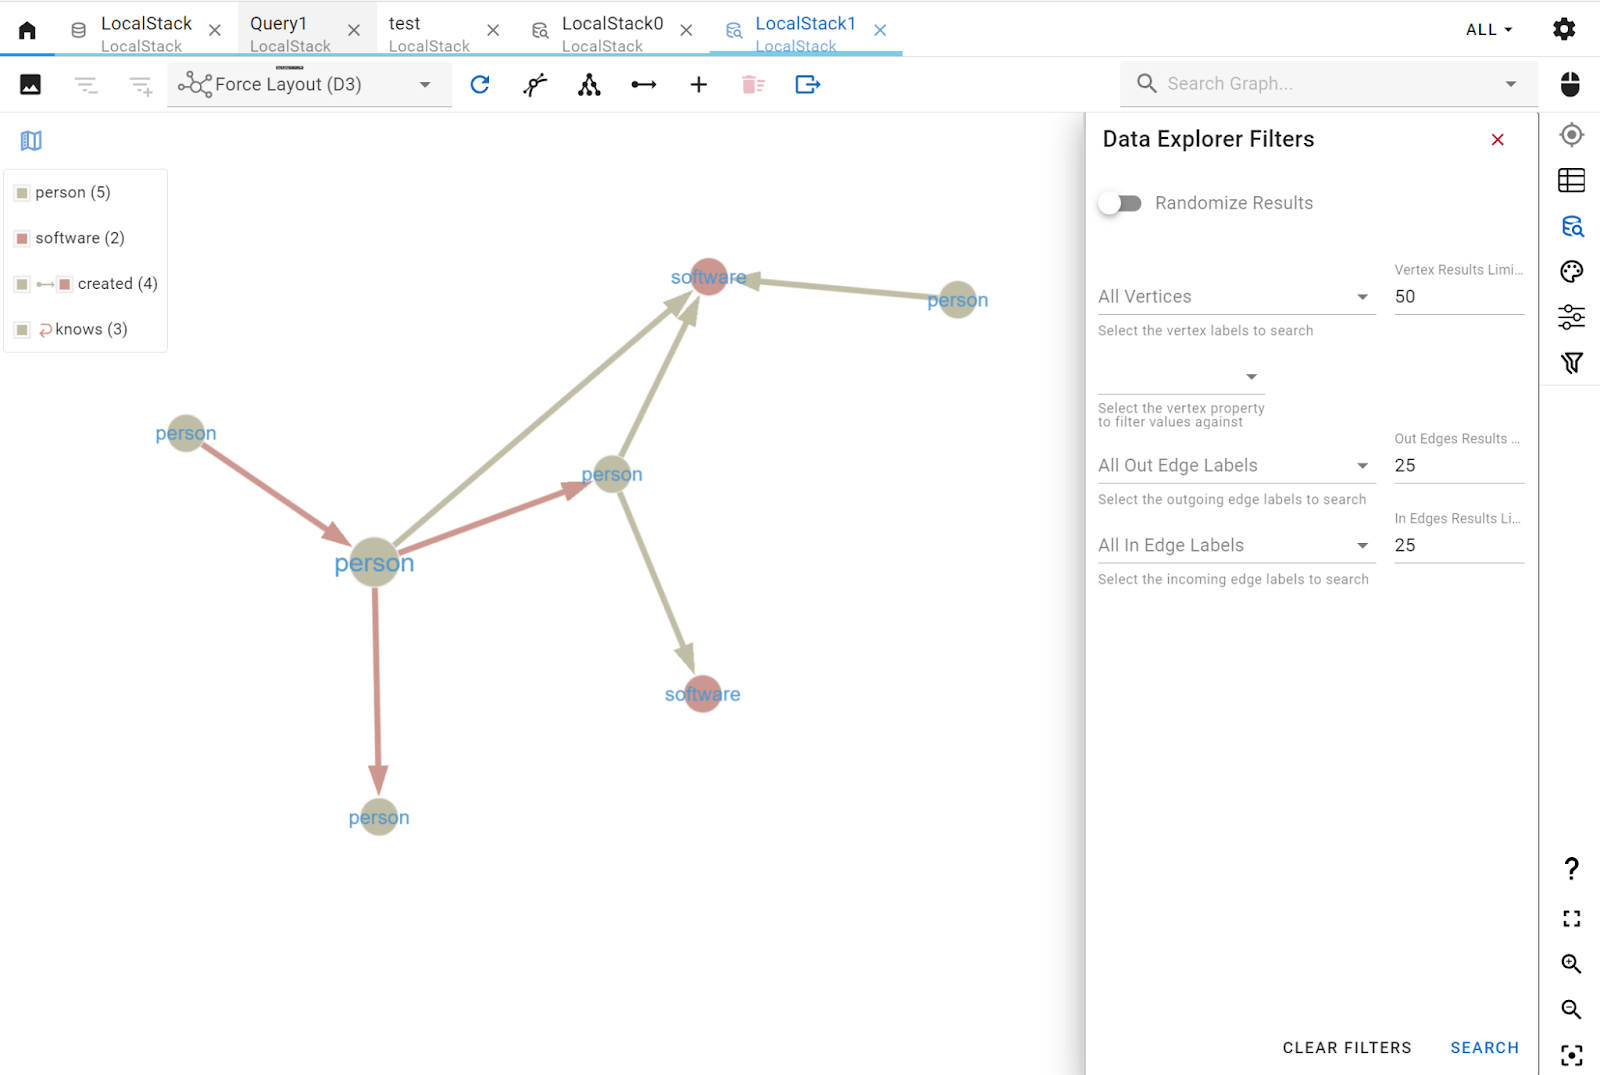
There are many additional features directly in the Graph view. You can filter and navigate data interactively either using the search bar or the smart filter tool. You can also edit vertices and edges directly through the user interface, click on an element to view its properties and details, or edit them.
G.V() offers a wealth of customisation options to help you create unique visuals for your data. Make sure to explore all of those as they will be especially useful when reporting on data in your production database, for instance.
Conclusion
With G.V(), you can considerably enhance your graph database development experience whilst gaining access to a powerful reporting and visualisation toolset for your production data. We’re just scratching the surface on what G.V() can do, and you can find out more on their documentation and their blog. Thanks to LocalStack’s core cloud emulator, parity is ensured between a local Neptune instance and AWS’s own, meaning Gremlin queries in your development environment will behave identically on Amazon Neptune.
For more information, check out the following YouTube video, where we demonstrate how to use G.V() with LocalStack Neptune:
If you have questions about configuring and running your project, you can find the G.V() team on the official Apache TinkerPop Discord or the LocalStack team on our Slack Community!