Streamlining Chaos testing with LocalStack's Chaos Engineering dashboard
Learn how to use LocalStack's Chaos Engineering Dashboard to simulate real-world failures like service outages and API errors locally. This guide shows how shifting chaos testing left helps developers fix resilience issues early, reducing costs and production risks.

Introduction
Failures are unavoidable in distributed systems. Chaos Engineering helps manage them by intentionally injecting faults. Controlled experiments, such as adding latency, simulating service or region failures, or testing missing timeout handlers, expose weaknesses in application resilience before they affect users. This allows engineers to prepare for disruptions instead of relying on reactive fixes in production.
LocalStack’s Chaos Engineering Dashboard makes it easy to run chaos experiments with templates for service outages, region failures, and network bottlenecks in a controlled local setup. It utilises the Chaos API under the hood to run experiments, enabling you to simulate real-world failures without impacting production. This helps validate error handlers, failovers, and other resilience mechanisms.
This post covers the benefits of running Chaos experiments locally. We’ll set up a sample cloud app, use the Chaos Engineering Dashboard to run experiments, explore different templates, and learn to fix resilience issues early. This shifts chaos testing left into development, reducing time and cost compared to cloud-based testing.
Why run Chaos experiments locally?
Modern cloud applications are distributed and event-driven, making them complex. While cloud providers offer resilience testing tools like AWS Fault Injection Simulator (FIS), running chaos experiments locally provides more flexibility, lower costs, and greater control.
Running chaos experiments in cloud environments often comes with challenges:
- High Costs: Simulating failures in production increases compute usage and potential downtime.
- Operational Risks: Injecting faults in live systems can unintentionally impact customers.
- Slow Iteration Cycles: Cloud testing requires resource provisioning, deployments, and waiting for feedback, slowing development.
By shifting chaos testing left into local development environments, teams can:
- Detect resilience issues before deployment.
- Test failure scenarios safely without affecting users.
- Accelerate debugging with controlled local experiments.
- Automate chaos testing in CI/CD pipelines.
LocalStack provides a cloud emulator for testing AWS workloads locally, removing the need for a live cloud account. This enables resilience testing by simulating service failures (e.g., API timeouts, rate limits, outages), injecting infrastructure anomalies via the Chaos Engineering Dashboard, and automating fault injection in CI/CD workflows.
By testing earlier in development, teams reduce the risk and cost of late-stage failures. This aligns with AWS’s Shared Responsibility Model, where AWS ensures resilience of the cloud, while customers manage resilience in the cloud by implementing fault tolerance, recovery mechanisms, and observability.
Running simulated failures locally validates resilience strategies before deployment, ensuring the system can handle real-world disruptions. Let’s explore how LocalStack enables this!
What is the Chaos Engineering dashboard?
The Chaos Engineering dashboard became available with the release of LocalStack 3.0. The dashboard uses our Chaos API, which supports advanced features such as probabilistic failures and customizable error codes, allowing for more detailed testing of system resilience.

The features of the dashboard include:
- Error Injection: Inject errors into services like DynamoDB and Kinesis, simulating
ProvisionedThroughputExceededExceptionexceptions. - HTTP Errors: Randomly terminate incoming requests or cause a specified percentage of API calls to fail with a
500 Internal Server Errorresponse. - Regional & Service Outages: Simulate AWS regional or service outages by disabling them.
- Latency Simulation: Introduce specified latency to API calls, useful for testing network performance.
These features come as templates you can manage directly in the LocalStack Web App without requiring you to write any configuration. Once you validate the template and its experiment, you can copy the Chaos API template and use it programmatically with cURL or integrate it into a testing framework of your choice.
You can start using the Chaos Engineering dashboard directly in the Web App: https://app.localstack.cloud/inst/default/chaos-engineering.
Setup an AWS serverless application locally
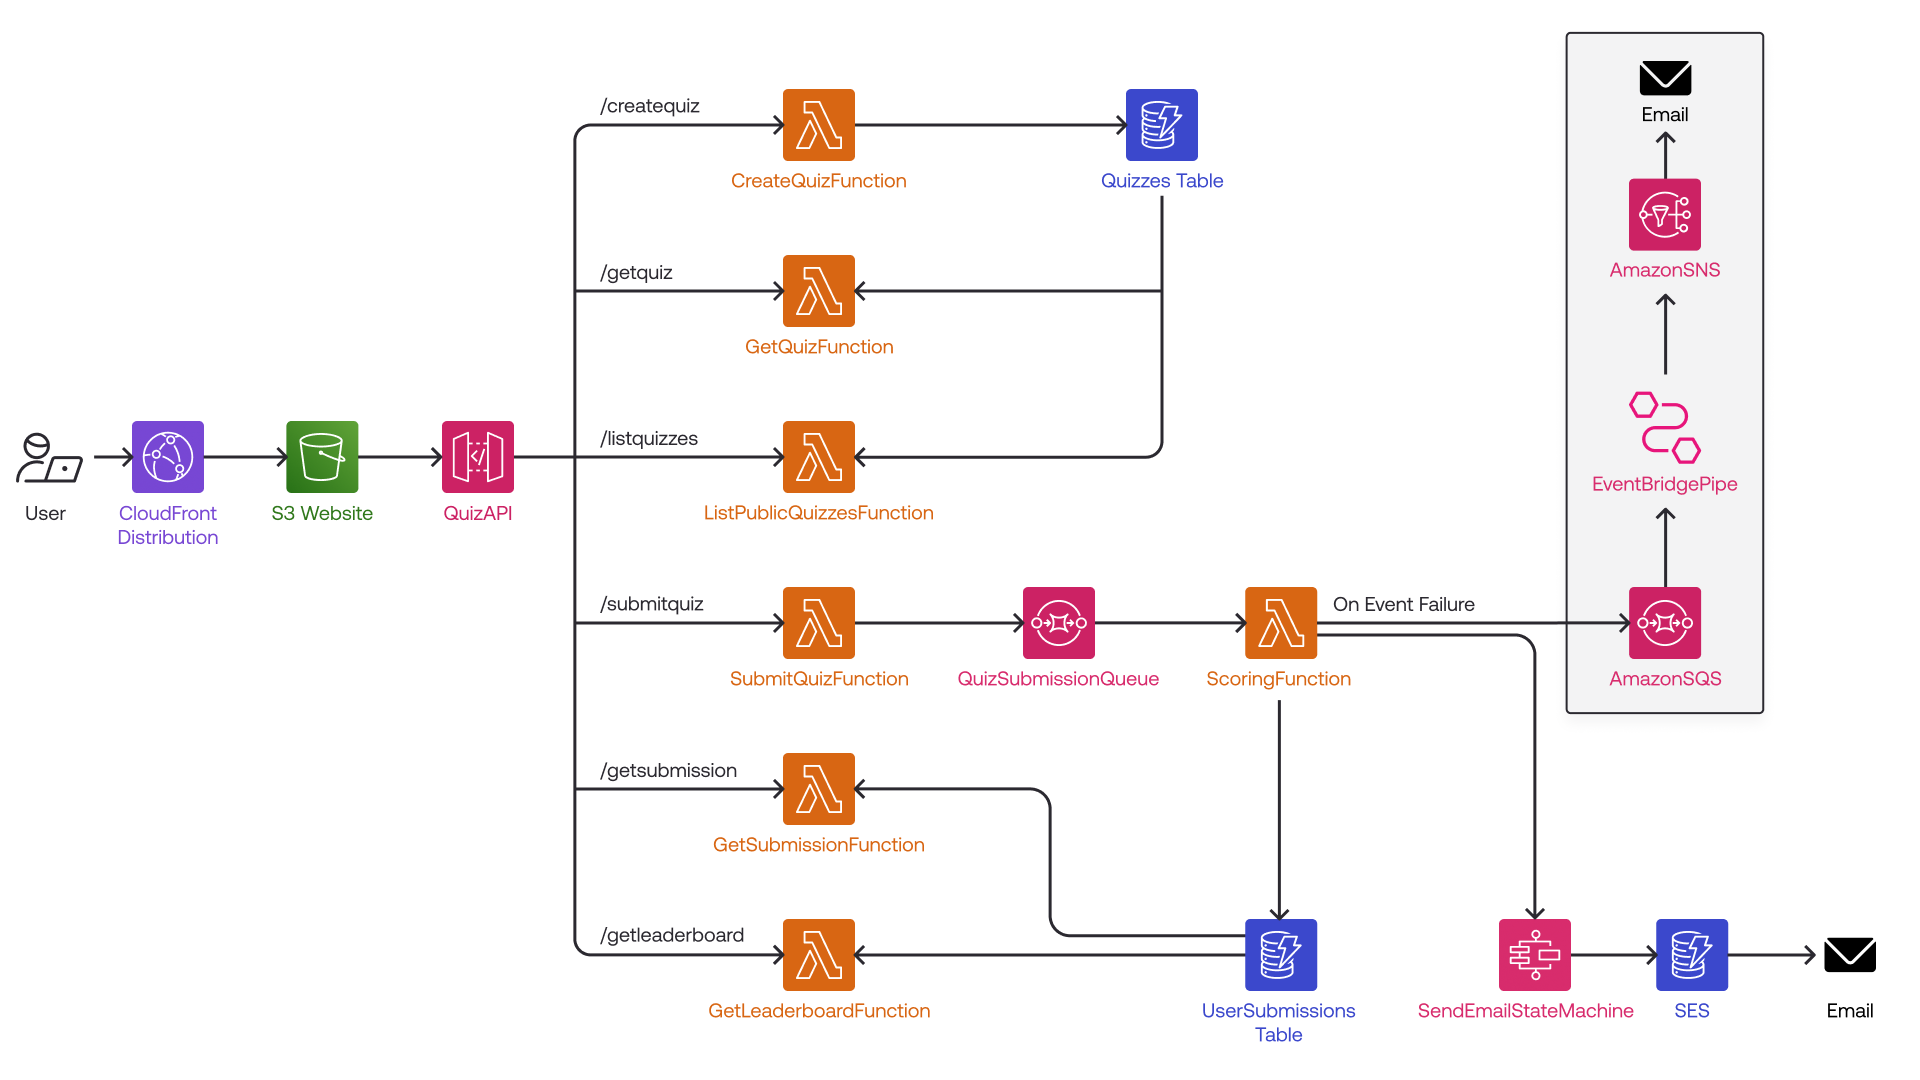
To demonstrate chaos testing in action, we’ll set up a simple AWS serverless application locally using LocalStack and the AWS CLI. The application allows users to create and play quizzes, simulating a real-world event-driven architecture.
While a full architecture would be more complex, we’ll focus on a core workflow:
- A user submits a quiz through an API Gateway endpoint.
- This triggers a Lambda function, which sends a message to an SQS queue.
- The message in the queue invokes another Lambda function, which processes the quiz submission and stores the results in DynamoDB.
To deploy this, ensure you have LocalStack installed and running, along with the awslocal CLI (a wrapper for aws CLI). Then, follow these steps:
git clone https://github.com/localstack-samples/serverless-quiz-appcd serverless-quiz-appbin/deploy.shThe deployment takes about 1-2 minutes. Once complete, you’ll see a CloudFront URL in the logs. Open the URL to play available quizzes or create your own.

With the application running locally, we can now introduce controlled failures using the Chaos Engineering dashboard to test its resilience.
Introducing the Provisioned Throughput Exceeded Exception
When working with DynamoDB and Kinesis, AWS enforces throughput limits based on the provisioned read and write capacity for a table (DynamoDB) or stream (Kinesis). If an application exceeds these limits, AWS responds with a ProvisionedThroughputExceededException error, indicating that the service is throttling the requests.
This error occurs when:
- A spike in read/write requests surpasses provisioned capacity.
- Background batch jobs or analytics queries overload the system.
- High-frequency writes flood a DynamoDB partition or overload a Kinesis shard.
- Applications lack retries or back-off mechanisms, leading to request failures.
With Chaos Engineering Dashboard, you can intentionally introduce this error into DynamoDB and Kinesis API responses.
To introduce the ProvisionedThroughputExceededException error in our local quiz application, you can navigate to the DynamoDB Error templatein the Chaos Engineering dashboard.
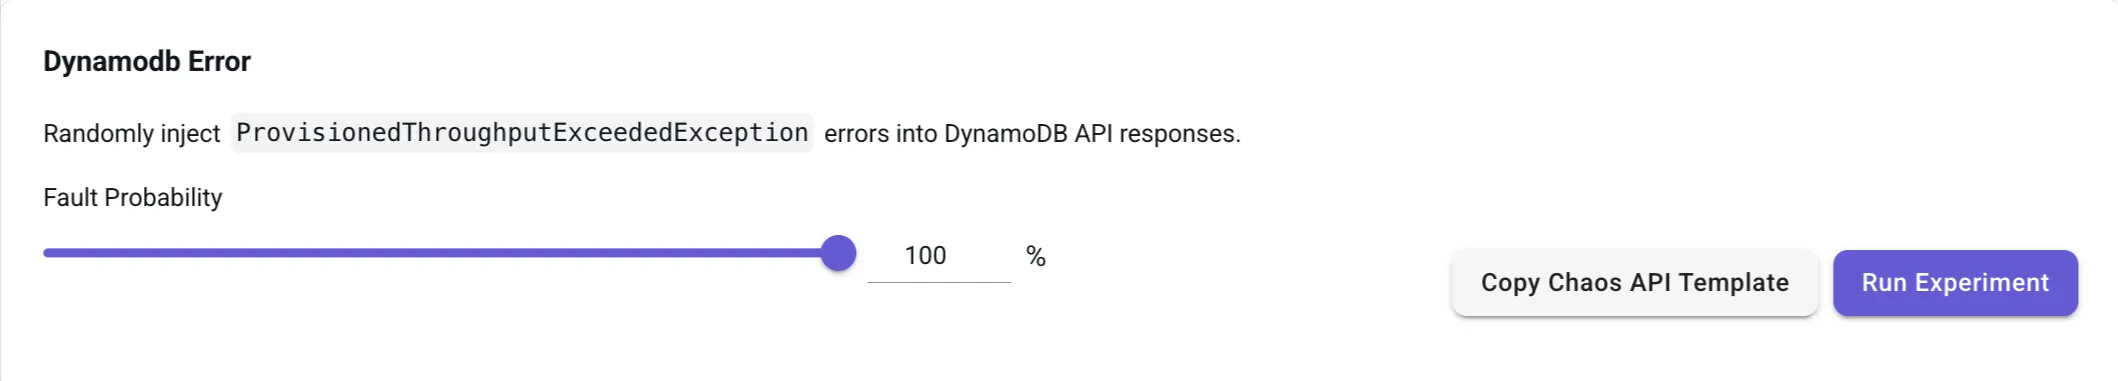
Adjust the Fault Probability slider:
- 100%: All API requests fail with
ProvisionedThroughputExceededException. - 50%: The error occurs randomly in half the requests.
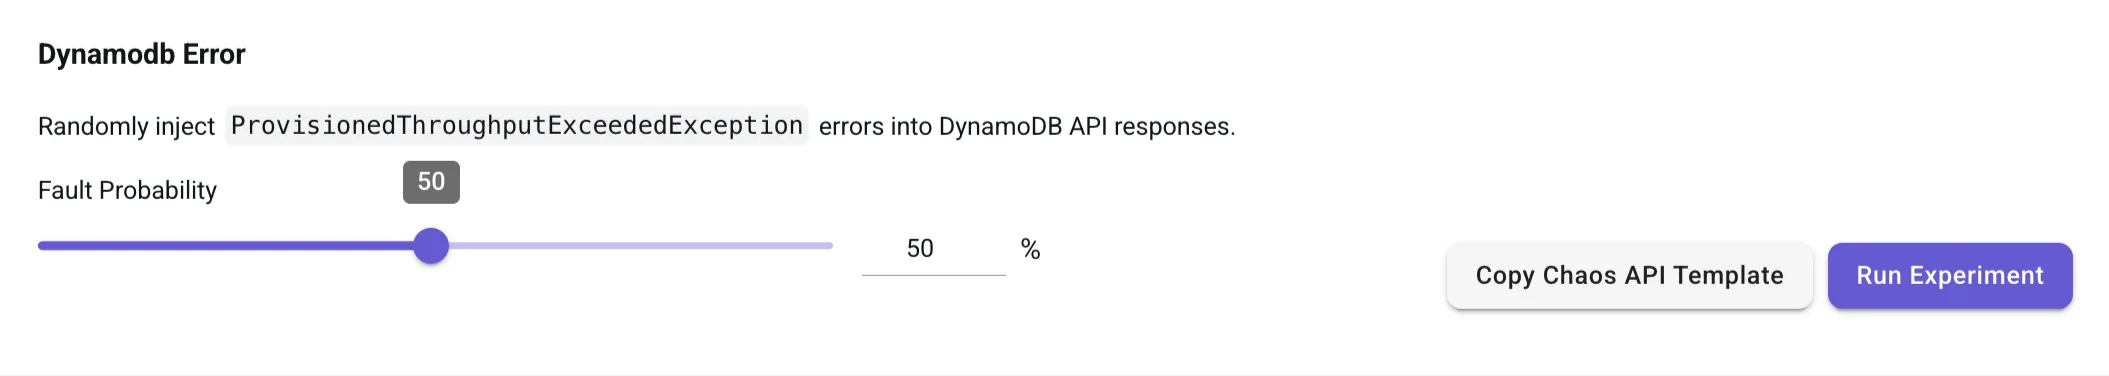
Click Run Experiment to activate the fault injection.
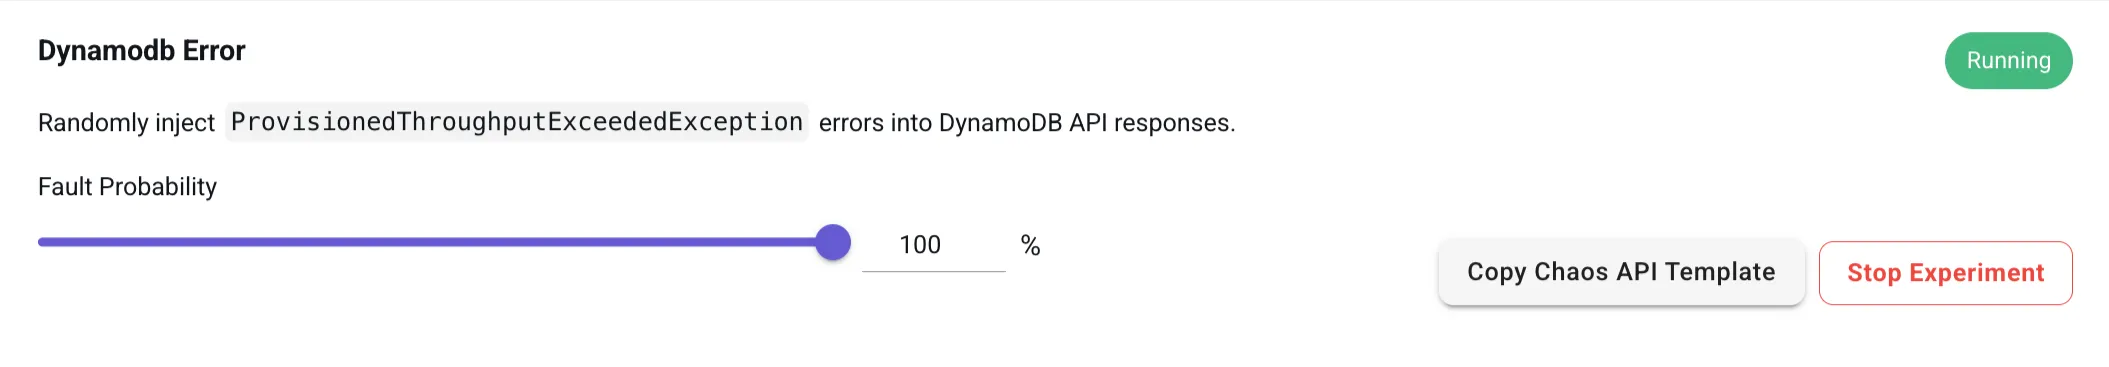
Once the experiment is running, navigate back to the Quiz Application. Refresh the page, after which quizzes will no longer be visible since DynamoDB scans are being throttled. Loading or submitting a quiz will also fail because DynamoDB is rejecting writes.
Check the LocalStack logs, and you’ll see error traces similar to this:
2025-03-17T17:38:14.175 DEBUG --- [et.reactor-6] l.pro.core.chaos.handlers : Fault rule #2 match: {'service': 'dynamodb', 'probability': 1, 'operation': 'Scan', 'description': 'dynamodbError', 'error': {'statusCode': 400, 'code': 'ProvisionedThroughputExceededException'}}...2025-03-17T17:38:33.474 DEBUG --- [et.reactor-4] l.s.l.i.version_manager : [ListPublicQuizzesFunction-2002dbdc-d88b-492e-a6a5-68231068383c] Error retrieving public quizzes: An error occurred (ProvisionedThroughputExceededException) when calling the Scan operation (reached max retries: 9): Operation failed due to a simulated faultSimilar to DynamoDB, you can also introduce fault probability for the Kinesis API, which allows you to validate how your system behaves under throttling conditions.
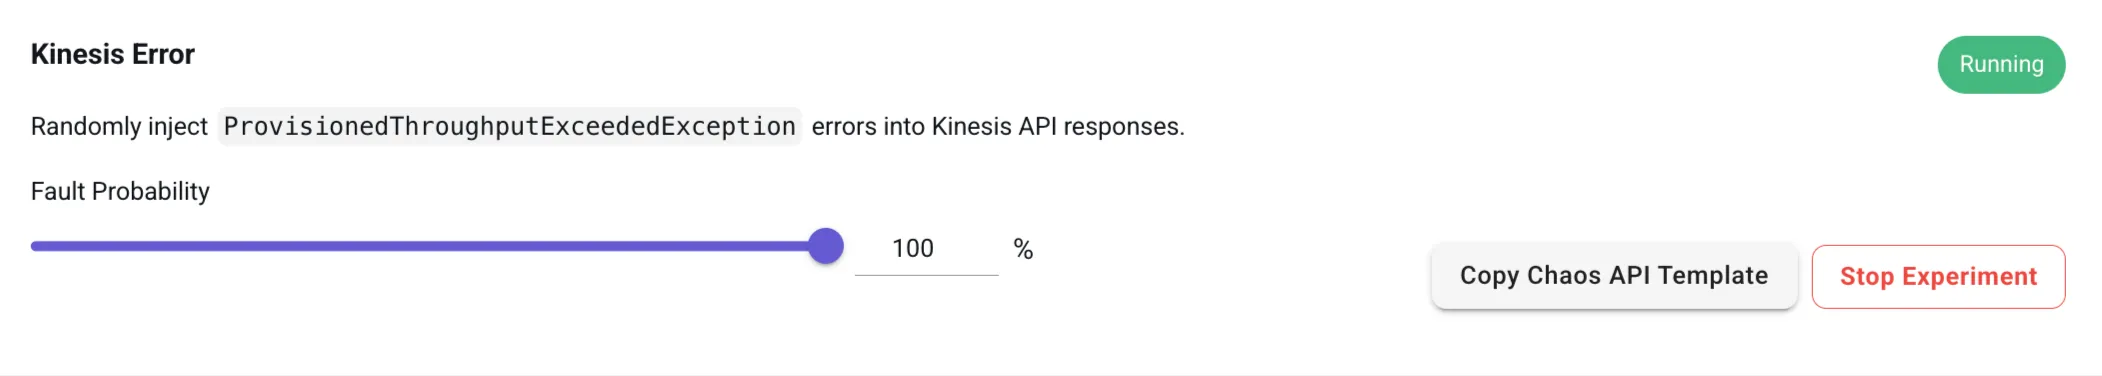
To mitigate this, you can follow various strategies like setting retry logic in applications using AWS SDKs, backoff mechanisms, and ensuring resilience against traffic spikes and observing how microservices handle failures when dependent components slow down.
Introducing the 500 Internal Error
A 500 Internal Server Error occurs when a server encounters an unexpected condition that prevents it from fulfilling a request. Unlike client-side errors (e.g., 404 Not Found), this is a server-side issue, indicating a failure in processing the request.
In real-world applications, this error can result from:
- Application crashes due to unhandled exceptions.
- Database failures that disrupt API response logic.
- Infrastructure misconfigurations, such as incorrect IAM permissions or missing environment variables.
- Overloaded services, where API Gateway or backend services fail to process requests.
Since these errors are generic and often lack detailed context, debugging them—especially in production—can be challenging. Chaos Engineering Dashboard allows you to inject 500 Internal Server Errors into your APIs to test how your application handles failure scenarios.
To inject 500 Internal Errors, navigate to the 500 Internal Error template in the Chaos Engineering Dashboard.
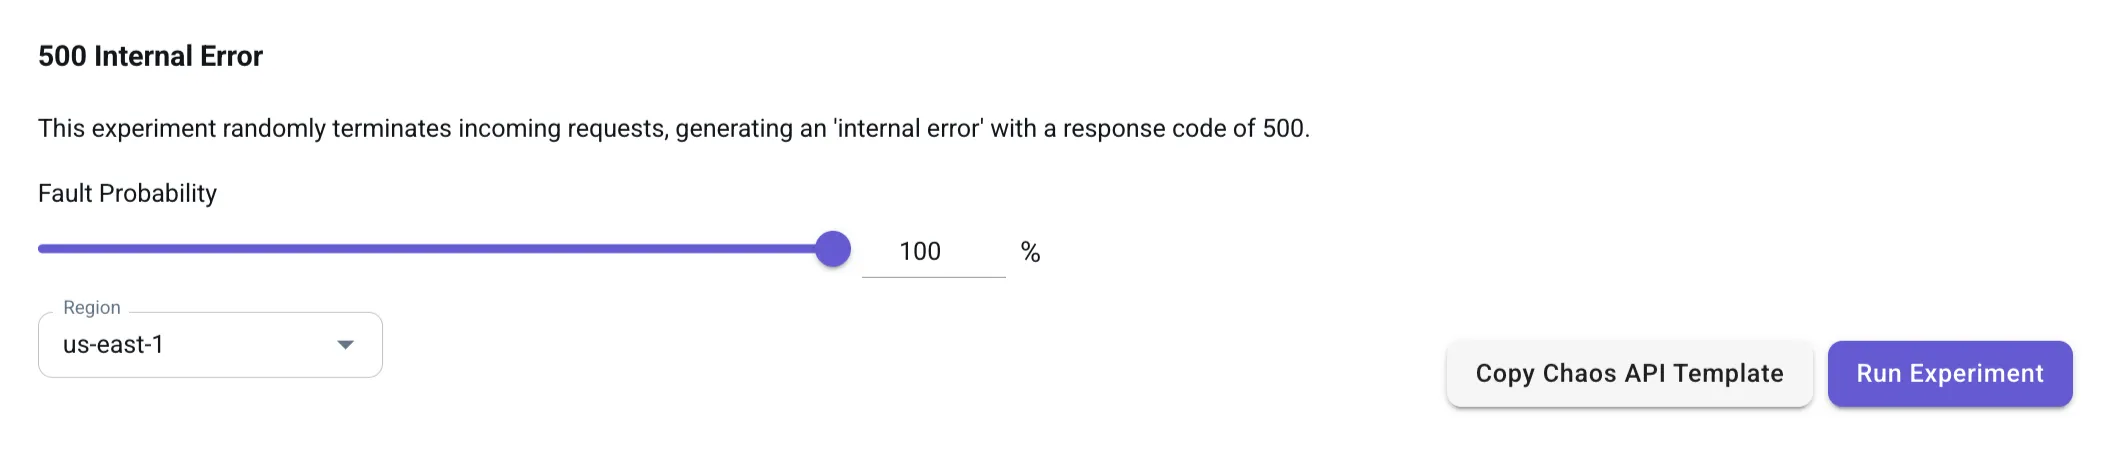
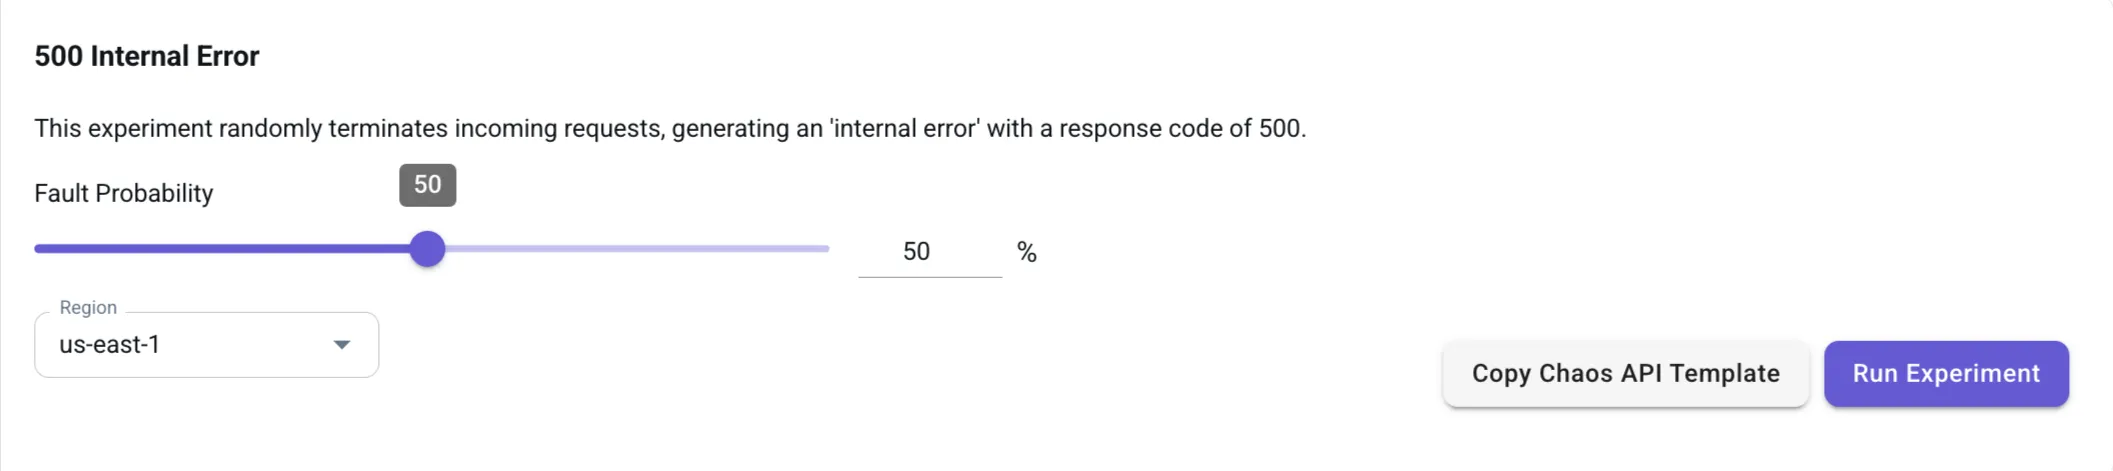
Adjust the Fault Probability slider:
- 100%: Every request fails with a 500 Internal Server Error.
- 50%: Half of the requests fail randomly.
Choose the Region (e.g., us-east-1) and click Run Experiment to activate the fault injection.
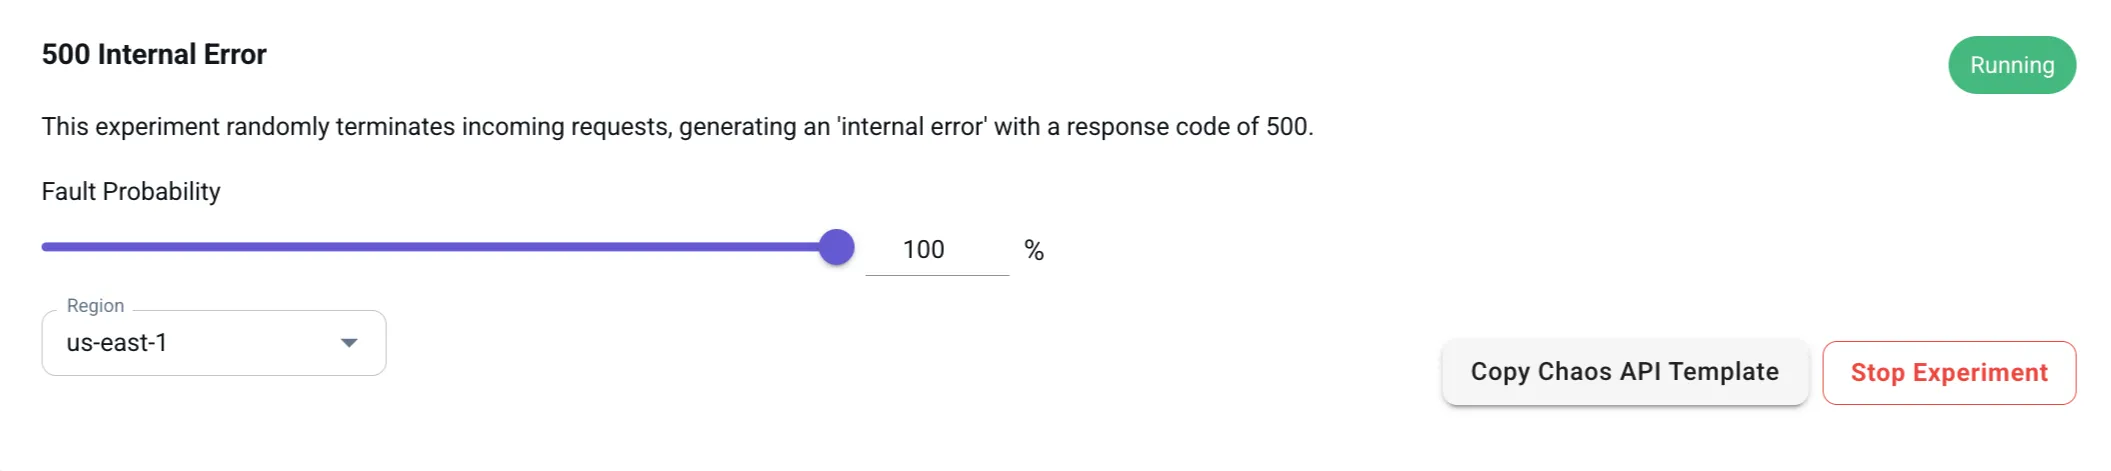
Once the experiment is active, go to your Quiz Application and refresh the page. The app will fail to load! Check the LocalStack logs, and you’ll see error traces like this:
2025-03-17T17:58:51.248 DEBUG --- [t.reactor-10] l.pro.core.chaos.handlers : Fault rule #0 match: {'region': 'us-east-1', 'probability': 1, 'description': 'internalServerError', 'error': {'statusCode': 500, 'code': 'InternalServerError'}}To mitigate this, you can validate error handling in frontend and backend services and test retry mechanisms in API calls. Furthermore, you can ensure graceful degradation in failure scenarios, and improve observability by logging detailed error traces.
Introducing service & region unavailability
In a real-world cloud environment, AWS services and entire regions can experience temporary outages due to various reasons, such as:
- Infrastructure failures due to network disruptions or hardware outages.
- Cloud provider maintenance which can either be planned or unplanned.
- Service throttling due to exceeding quota limits.
- Dependency failures wherein a critical service is failing and affecting other services.
When an AWS region or service becomes unavailable, applications relying on them may stop functioning unless they have built-in failover mechanisms. Chaos Engineering Dashboard allows you to disable specific AWS services or simulate complete regional outages in your local testing environment.
To configure this experiment, navigate to the Service Unavailable template in the Chaos Engineering Dashboard.
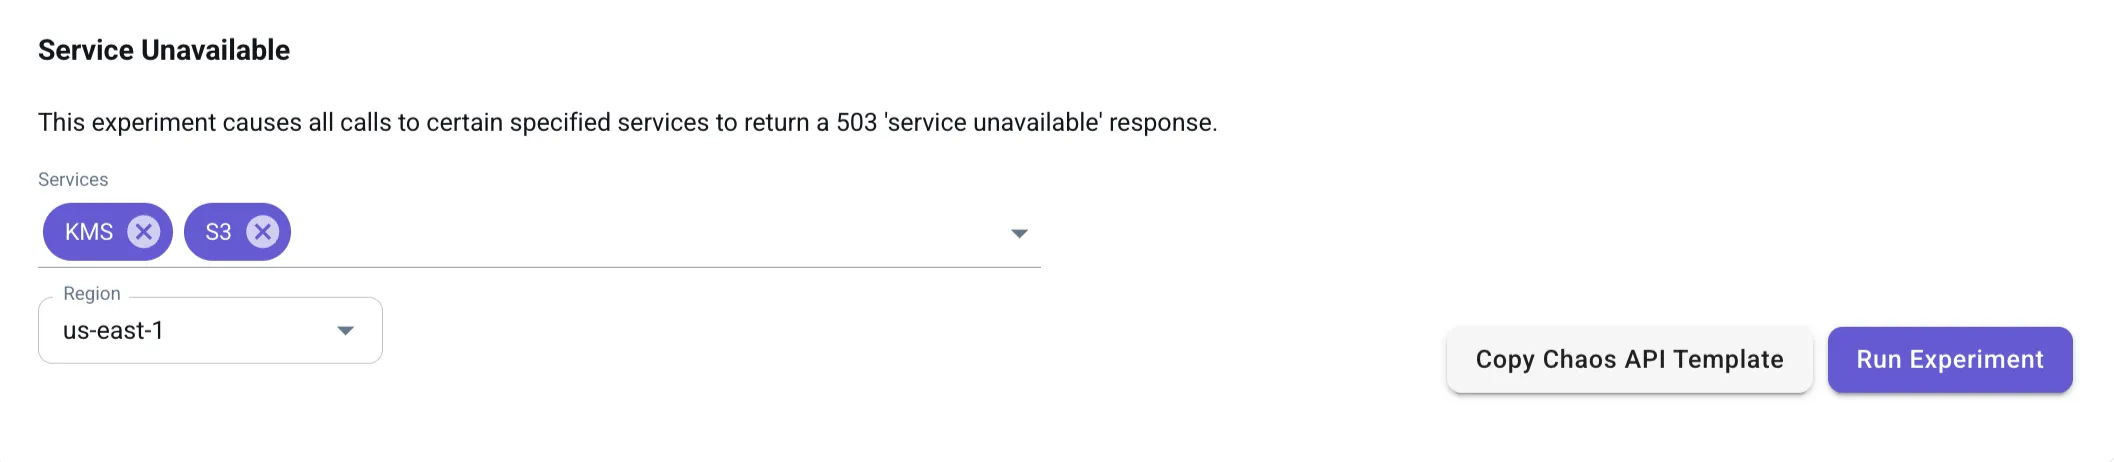
Choose:
- A specific AWS service to disable (e.g., DynamoDB).
- The AWS region where you want to simulate the outage (us-east-1).
Click Run Experiment to activate the service failure.
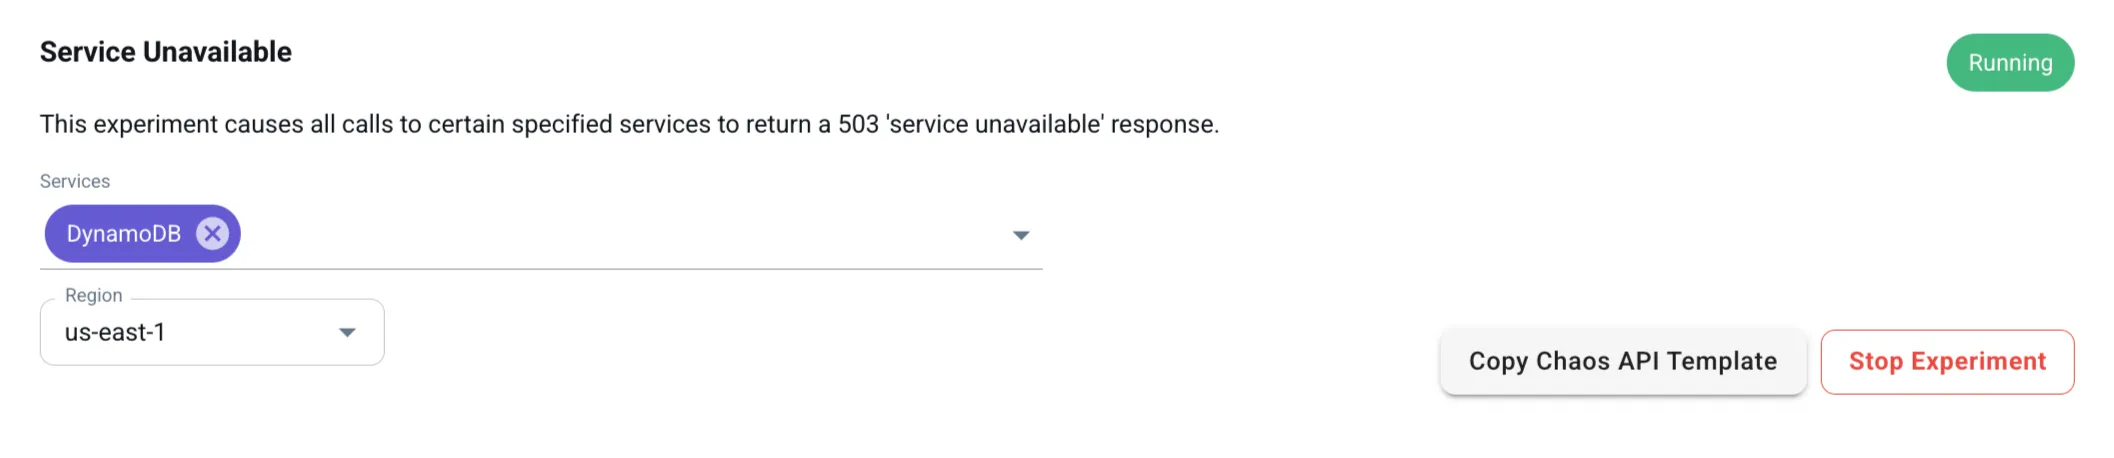
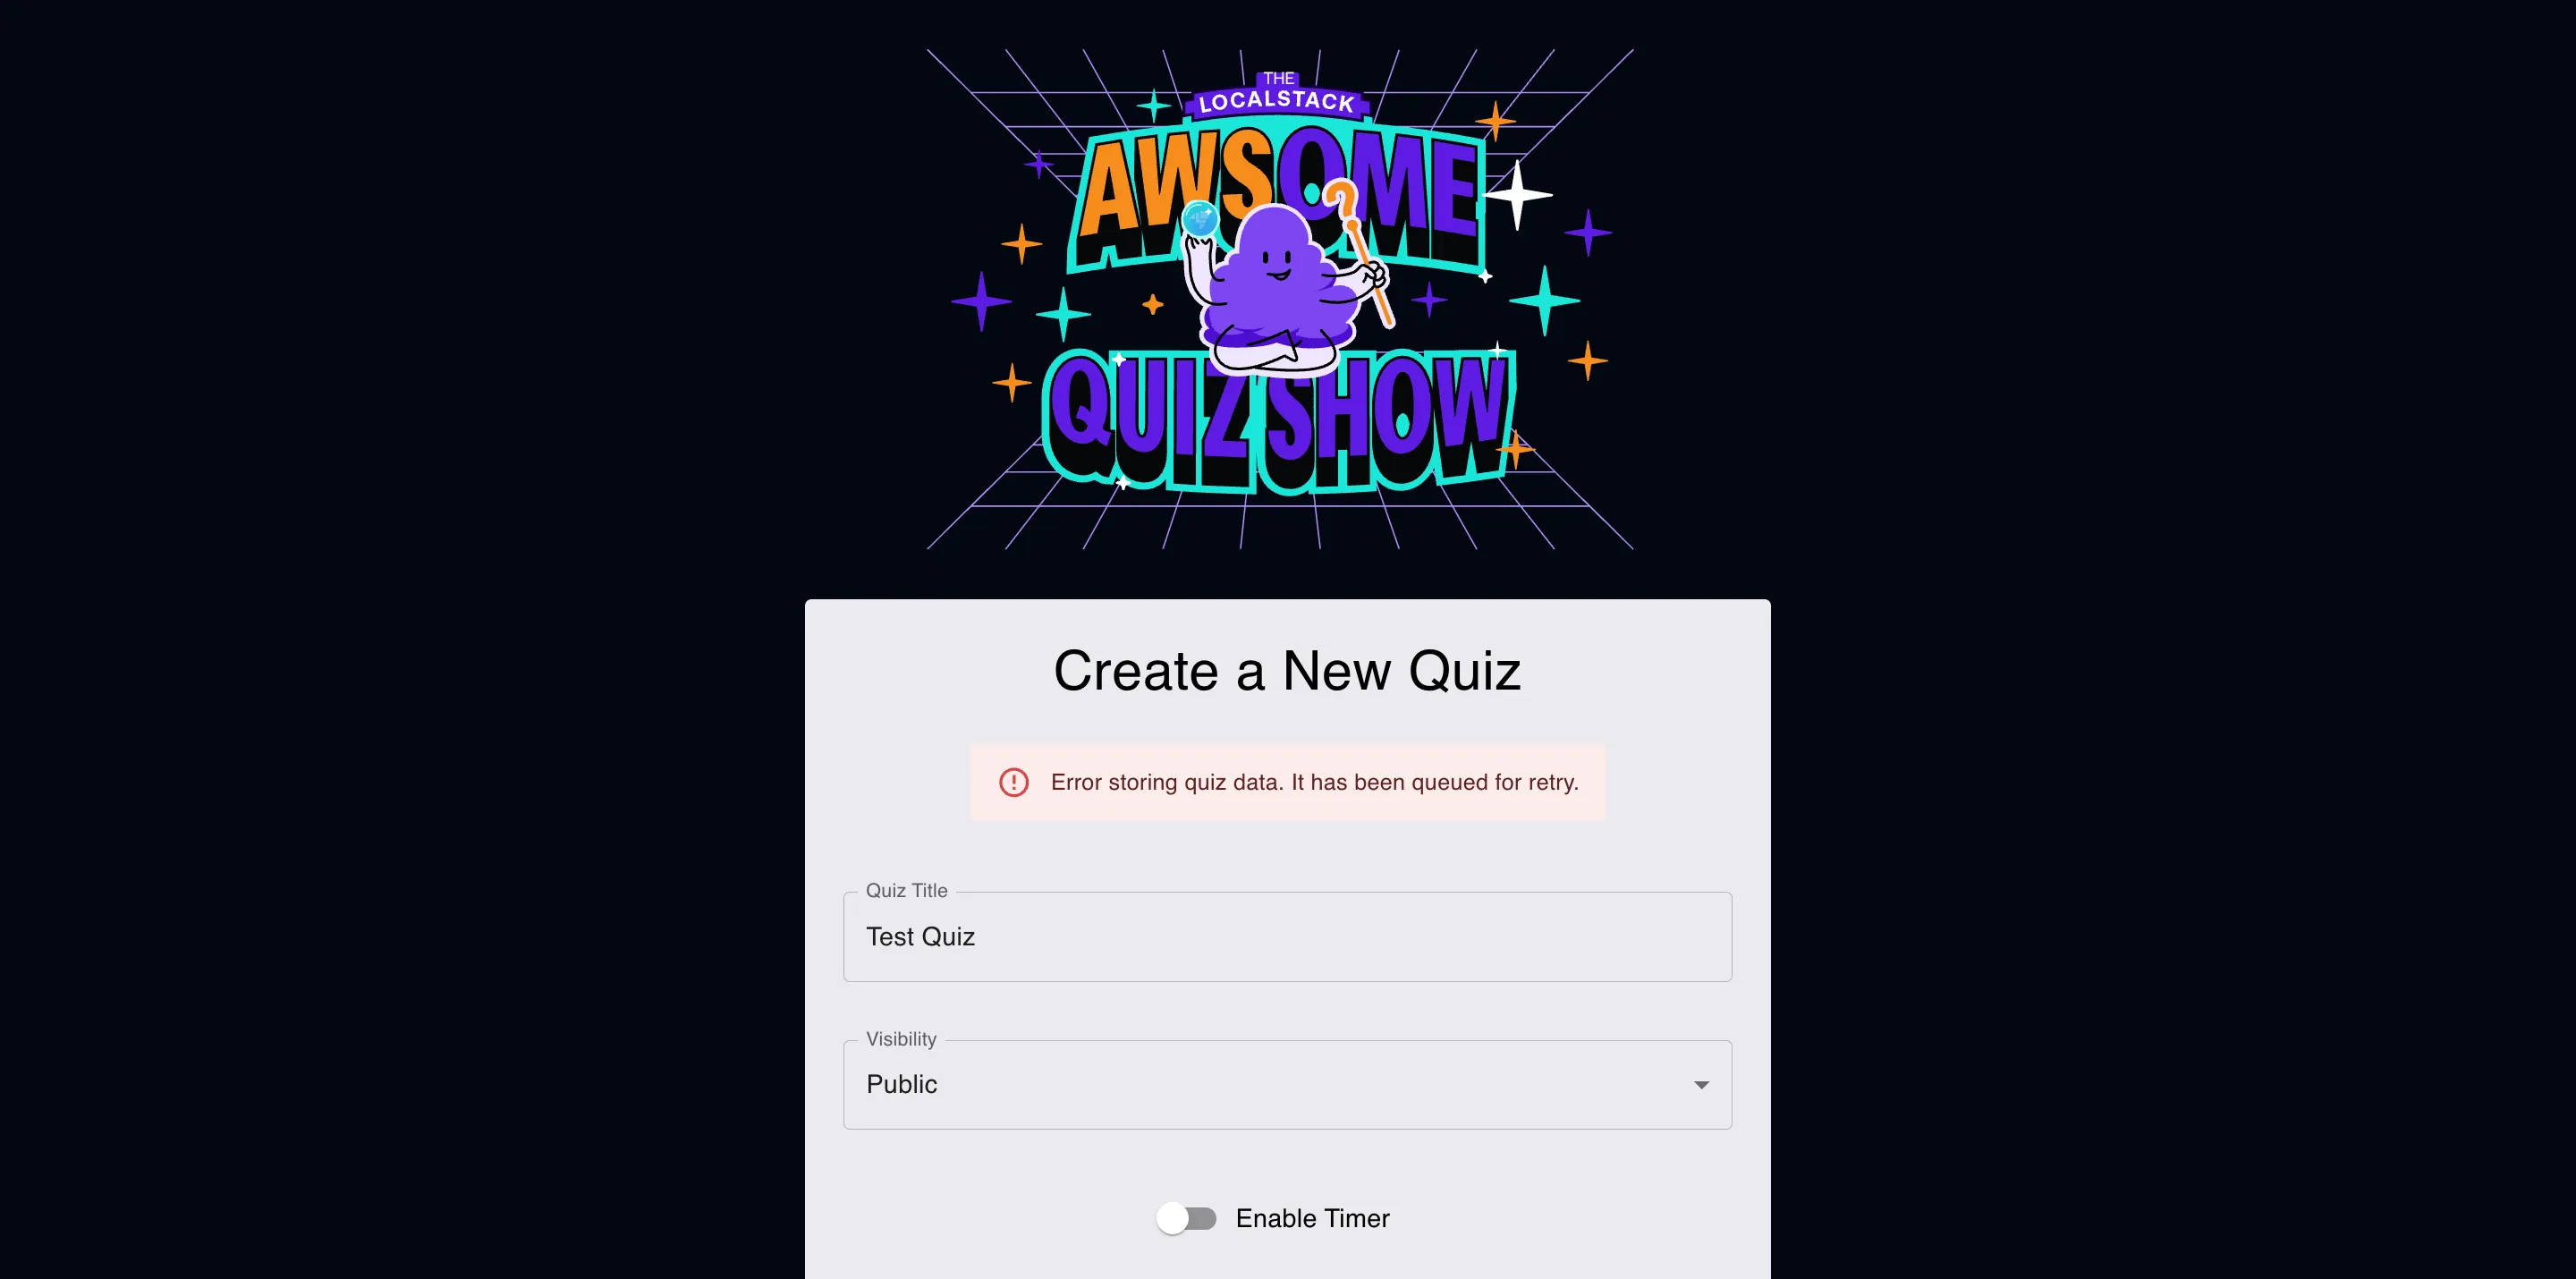
Let’s apply this to our Quiz Application. Disable dynamodb in us-east-1 using the Chaos Engineering dashboard. Navigate to the app and try creating a public quiz. The quiz creation will fail and the app will notify you that the quiz was not created.
Check the LocalStack logs, and you’ll see error traces like this:
2025-03-17T18:15:12.899 DEBUG --- [et.reactor-0] l.pro.core.chaos.handlers : Fault rule #0 match: {'service': 'dynamodb', 'region': 'us-east-1', 'description': 'serviceUnavailableError', 'error': {'statusCode': 503, 'code': 'ServiceUnavailable'}}2025-03-17T18:15:12.901 INFO --- [et.reactor-0] localstack.request.aws : AWS dynamodb.PutItem => 503 (ServiceUnavailable)This log confirms that DynamoDB requests in us-east-1 are failing due to the simulated outage.
Now, stop the experiment in the Chaos Engineering Dashboard. Wait for a few seconds and refresh the app. You will now see the quiz successfully created, even though the app was previously experiencing an outage!
This behavior is possible due to a resilient architecture pattern that ensures eventual consistency:
- When a new quiz is created while DynamoDB is unavailable, the request is not lost.
- Instead, the request is captured in an SNS topic and forwarded to an SQS queue.
- A Lambda function continuously attempts to process the request until the DynamoDB table becomes available again.
- Once DynamoDB is back, the Lambda function automatically retries the operation, ensuring the quiz is successfully created.
This event-driven approach prevents data loss and allows applications to function smoothly even during temporary service outages.
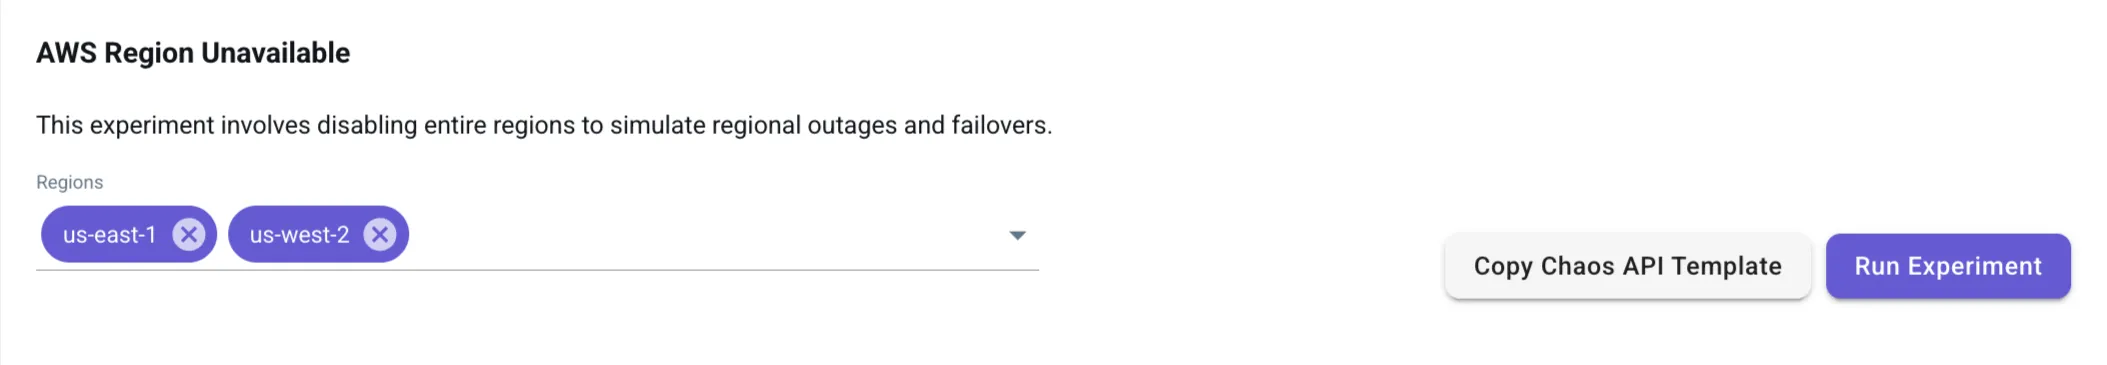
Beyond individual service failures, you can simulate region-wide outages by disabling an entire AWS region (e.g., us-east-1). This would cause the application to fail.
To mitigate this, you can enable multi-region replication and automated failovers, and use services like SNS and SQS for buffering requests to prevent immediate failures. This will ensure that your system will be more resilient, ensuring that when an actual AWS outage happens, your application can recover automatically—without impacting users.
Introducing Latency
Latency is a critical factor in distributed systems, where microservices, cloud APIs, and databases communicate over a network. Real-world causes of latency include:
- Network congestion affecting API calls.
- Slow database queries under heavy load.
- Service degradation during high-traffic periods.
- Cloud provider issues causing regional slowdowns.
Even small delays in API response times can lead to significant performance degradation, affecting the user experience, system reliability, application stability, and any third-party integrations that your app depends on. With Chaos Engineering Dashboard, you can artificially introduce latency into API responses to test system behavior under slow network conditions.
To introduce API latency, navigate to the Latency template in the Chaos Engineering Dashboard.
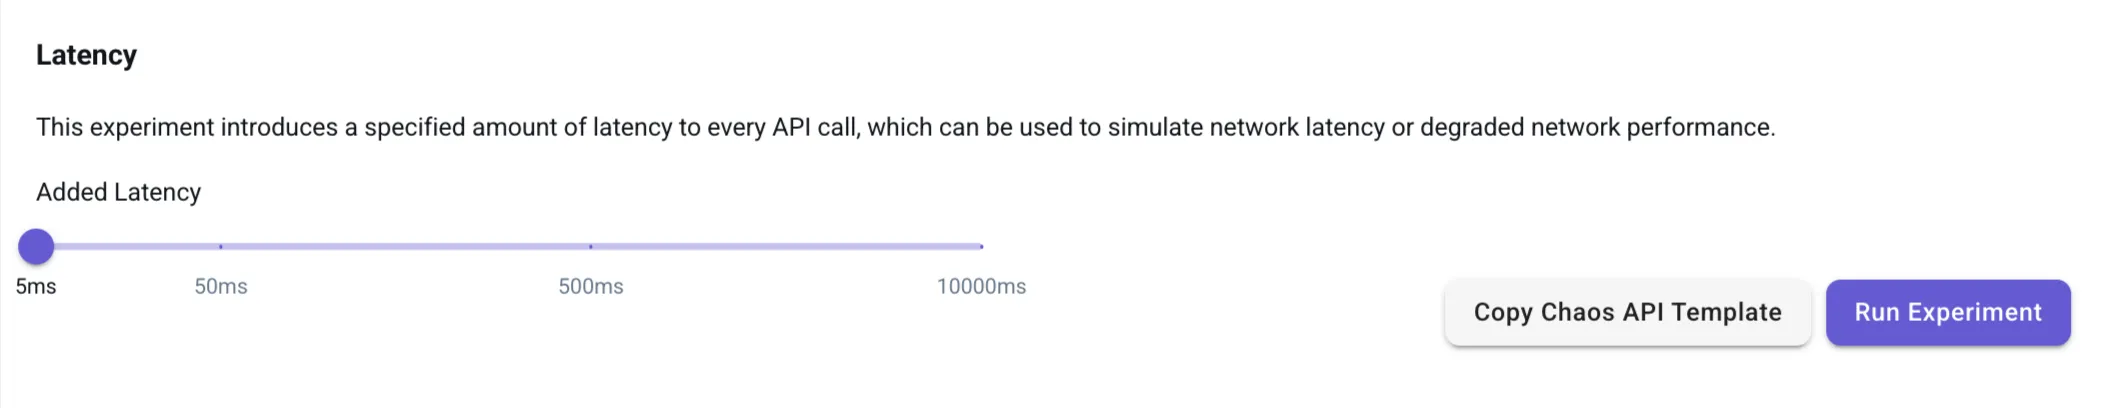
Adjust the Added Latency slider:
- 5ms: Minimal impact, useful for baseline testing.
- 50ms - 500ms: Simulates mild network latency.
- 1000ms (1s) - 10,000ms (10s): Simulates severe network degradation.
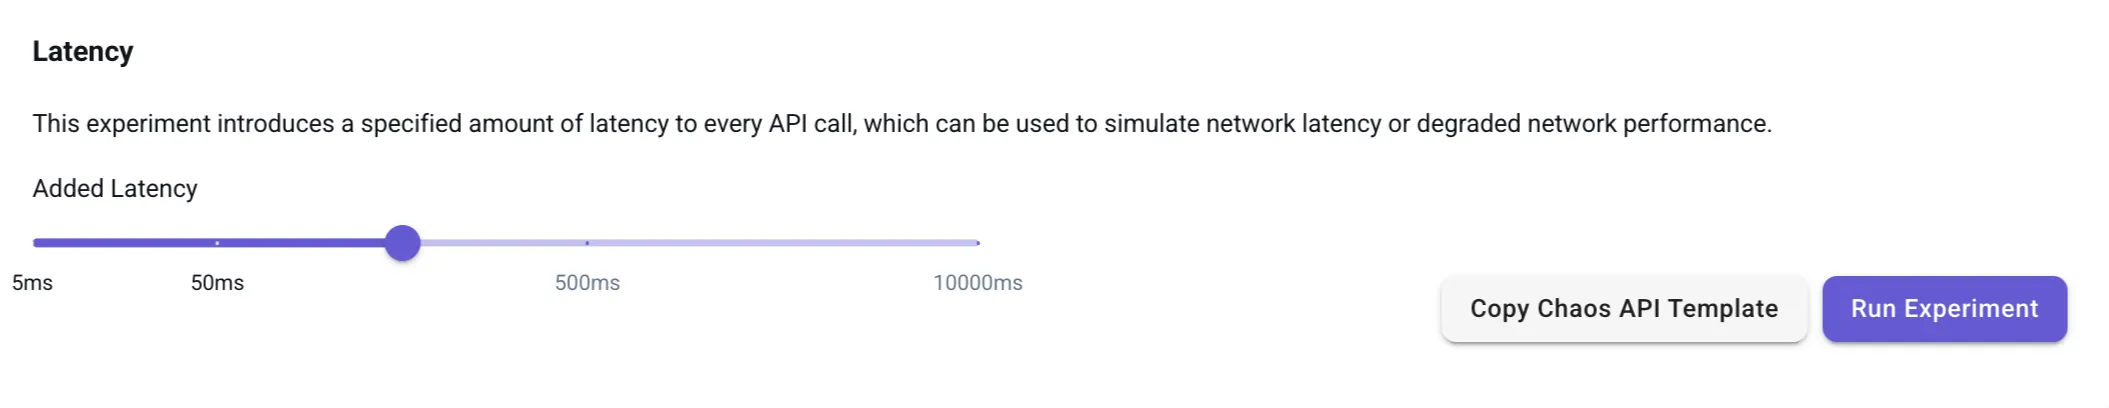
Click Run Experiment to activate latency injection.
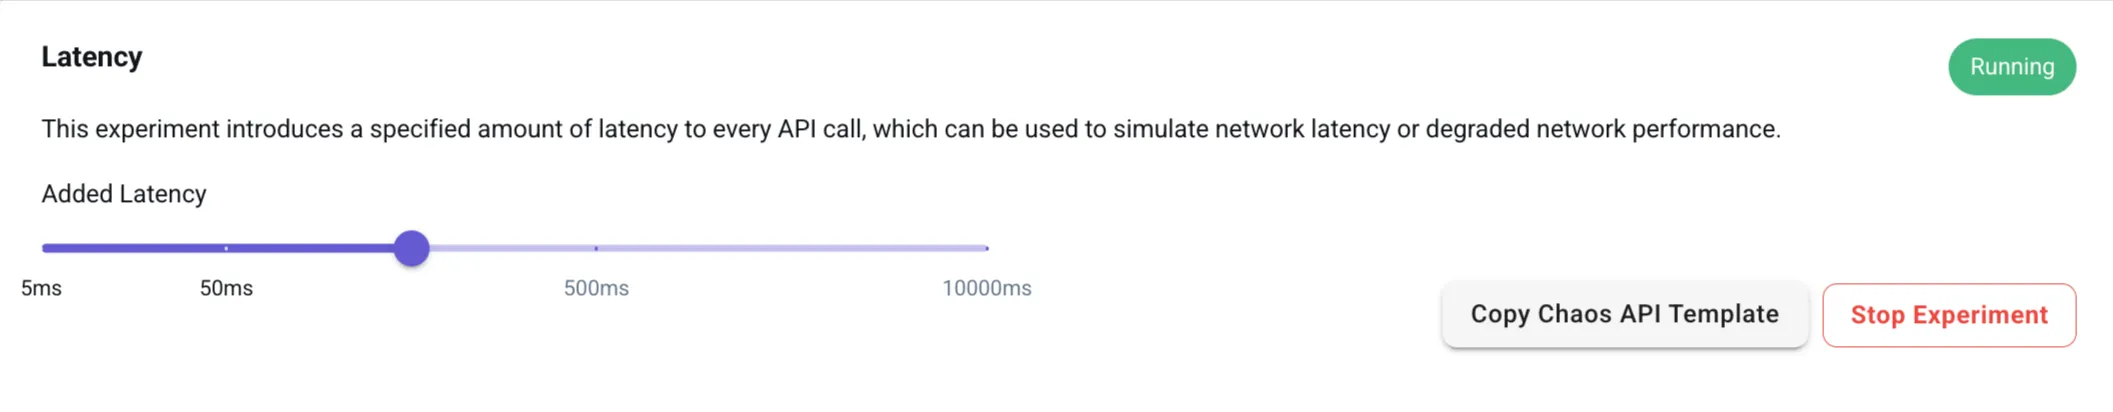
Once the experiment is active, navigate to the Quiz Application, try loading the app or submitting a quiz, and note that the app will become extremely slow or even fail to load.
To mitigate this, you can set reasonable timeouts in API calls to prevent excessive delays, add circuit breakers to automatically failover to cached responses if latency is too high or use async processing to avoid UI freeze during long API calls. By proactively testing latency failures, you ensure that when real-world network slowdowns occur, your application remains stable and recovers gracefully.
Conclusion
This post covered how to run chaos experiments and resiliency tests on local cloud applications using the LocalStack Chaos Engineering Dashboard. Shifting chaos testing left allows teams to simulate real-world failures, like service outages, API errors, and latency, meaning developers can test their application’s resilience before production deployment.
Beyond the dashboard, the Chaos API enables automation by defining fault conditions programmatically. Each rule specifies failure conditions across services, regions, and operations, allowing precise and probabilistic fault injection. The API, available at http://localhost.localstack.cloud:4566/_localstack/chaos, supports standard HTTP verbs to dynamically add, modify, or remove experiments.
So if you’re using LocalStack, you can integrate chaos testing into development safely and cost-effectively, without impacting production, ensuring your cloud application’s resiliency and its ability to handle failures gracefully.

Related Articles

Harsh Mishra and Brian Rinaldi •