Test Monitoring for LocalStack Apps
Developing Serverless Applications Locally with LocalStack and Debugging Tests with Thundra Foresight.

📢 Thundra Inc and its product Foresight have ceased operations and have been acquired by Catchpoint, resulting in significant changes to their products and services. Please note that the tutorial provided in our blog may no longer be applicable or functional with the latest updates. We are keeping this blog post available for informational purposes only.
LocalStack gives developers the freedom to develop their cloud applications locally (even offline) - enabling a highly efficient dev&test loop. It also helps prevent scary cloud bills at the end of every month! LocalStack has an amazing community of users, contributors, and supporters - and generally demonstrates a very strong commitment to supporting open source.
The community uses LocalStack for many use cases such as developing microservice cloud applications. One of the strongest use cases why developers use LocalStack is “testing”. Since the local testing framework is provided, the need for setting up multiple testing environments on the cloud disappears and distributed microservice applications can easily be developed, tested, and deployed with green tests.
But, wait! Not everything will go so smoothly all the time. Oh, I wish we were in such a fairy tale where the horses were unicorns with wings, and tests passed in the first run.
It’s a fact that tests fail. All the time! Some erroneous tests make developers tear their hair out while trying to find the root cause in the log piles. And sometimes it is not a road blocker but it is definitely a fly in the ointment.
Today, it’s such a pain relief to use LocalStack while developing test environments. It saves us from setting up complex cloud environments with its easy-to-use mocked cloud services. On the other hand, there is still a need for debugging failed tests without getting lost within the logs of our complex architectures.
This is when Thundra comes to the rescue with Foresight for those who use LocalStack on their local development machine or in their Continuous Integration (CI) pipeline. Foresight helps developers understand the root causes of failing & long-running tests easily and quickly. It gives rich insights about the passed, failed, aborted tests of the test runs of the test suites.
Sample application
Let’s talk about how we can get the best out of these two products. For this purpose, we’ve developed a small application. An application that’ll spawn multiple AWS services on your local machine with LocalStack and monitor your distributed architecture and its tests with Thundra Foresight.
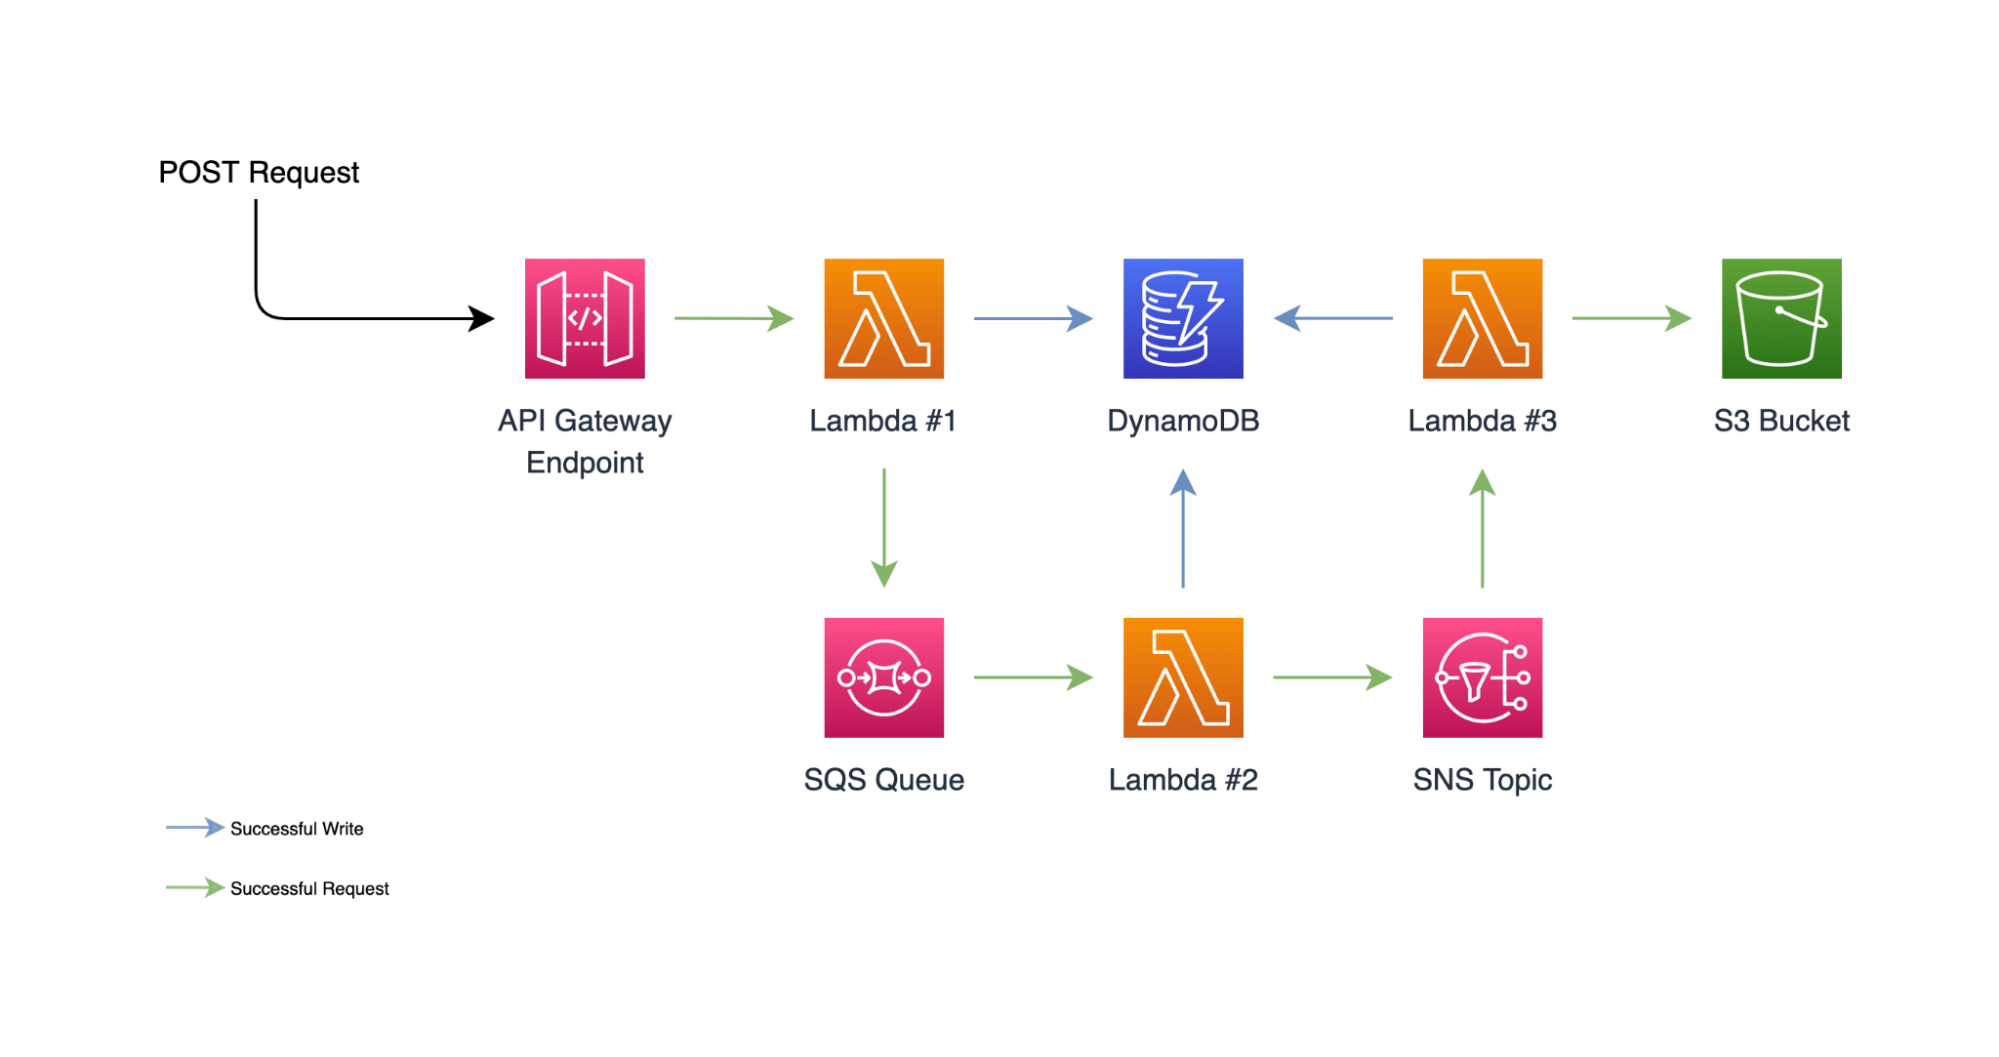
What we’ve planned here is somewhat simple. An AWS Lambda function, let’s call this Lambda #1, with an HTTP endpoint to take a request then writes to an SQS queue for further processing and then writes the same request into a DynamoDB database for bookkeeping purposes. Then, that SQS queue will pass the incoming message to our processor Lambda, our Lamda #2.
Once the processing is successful, Lambda #2 will notify an SNS topic, which triggers our archive Lambda, Lambda #3. When Lambda #3 is triggered, it’ll go back to the DynamoDB and update the request’s record, and set its state. It’ll also write the result of this whole request into a file and put it in an S3 bucket.
This might seem a lot, but all it does is pass the body of an HTTP request between different services and manipulate it along the way. This project is developed by Thundra’s Software Engineer Tolga Takır and the source code is available in our GitHub repository. In there, you’ll find the documentation on how to run this project on your machine.
After having all the requirements set up on our computer, we can simply run make start to spin up our application with LocalStack. This will take a couple of minutes, but once it’s completed, we’ll have our API running inside the LocalStack container.
At this point, we can run the following command to see if our API is up and running.
awslocal apigateway get-rest-apis{ "items": [ { "id": "<YOUR_APIGATEWAY_ID>", "name": "local-thundra-demo-localstack", "createdDate": "2021-09-06T13:54:57+03:00", "version": "V1", "binaryMediaTypes": [], "apiKeySource": "HEADER", "endpointConfiguration": { "types": [ "EDGE" ] }, "tags": {}, "disableExecuteApiEndpoint": false } ]}If this result comes up empty, you might be looking in the wrong region.
We’ve confirmed that our API is up and running. You can also send a GET request to Lambda’s endpoint. This might take some time since it’s a cold start, but eventually, it should return an empty list.
curl http://<YOUR_APIGATEWAY_ID>.execute-api.localhost.localstack.cloud:4566/local/requests
[]%
Let’s see what Thundra Foresight can do now. We can kill the current LocalStack container, we won’t be needing it for running the tests.
How to integrate Foresight into LocalStack
Thundra Java Agent comes built-in with LocalStack v0.12.16 and later. If you have the latest version of LocalStack, all you need to do is set THUNDRA_APIKEY as an environment variable and you are good to go with application monitoring. To enable Foresight as well, THUNDRA_AGENT_TEST_PROJECT_ID environment variable must be set.
You can get your API Key and Project ID at https://foresight.thundra.io.
For this project, you can set them in the Makefile. If that’s done, let’s run the tests with make test. After some time, if the demo gods are with us and we don’t have any problem, we should be able to see the results.
[INFO][INFO] Results:[INFO][ERROR] Failures:[ERROR] AppRequestLocalStackTest.testCreateNewRequest:30->LocalStackTest.assertEventually:90->lambda$testCreateNewRequest$0:38 [Extracted: requestId, status]Expecting ArrayList: [("ae1bd554", "PROCESSING"), ("ae1bd554", "QUEUED")]to contain: [("ae1bd554", "QUEUED"), ("ae1bd554", "PROCESSING"), ("ae1bd554", "FINISHED")]but could not find the following element(s): [("ae1bd554", "FINISHED")][INFO][ERROR] Tests run: 1, Failures: 1, Errors: 0, Skipped: 0[INFO][INFO] ------------------------------------------------------------------------[INFO] BUILD FAILURE[INFO] ------------------------------------------------------------------------[INFO] Total time: 02:00 min[INFO] Finished at: 2021-09-06T21:21:01+03:00[INFO] ------------------------------------------------------------------------Looks like our test has failed. By looking at the logs, I can tell that we didn’t get the FINISHED state in our collection. Let’s check Foresight and then click to our test to see if we can see what went wrong.
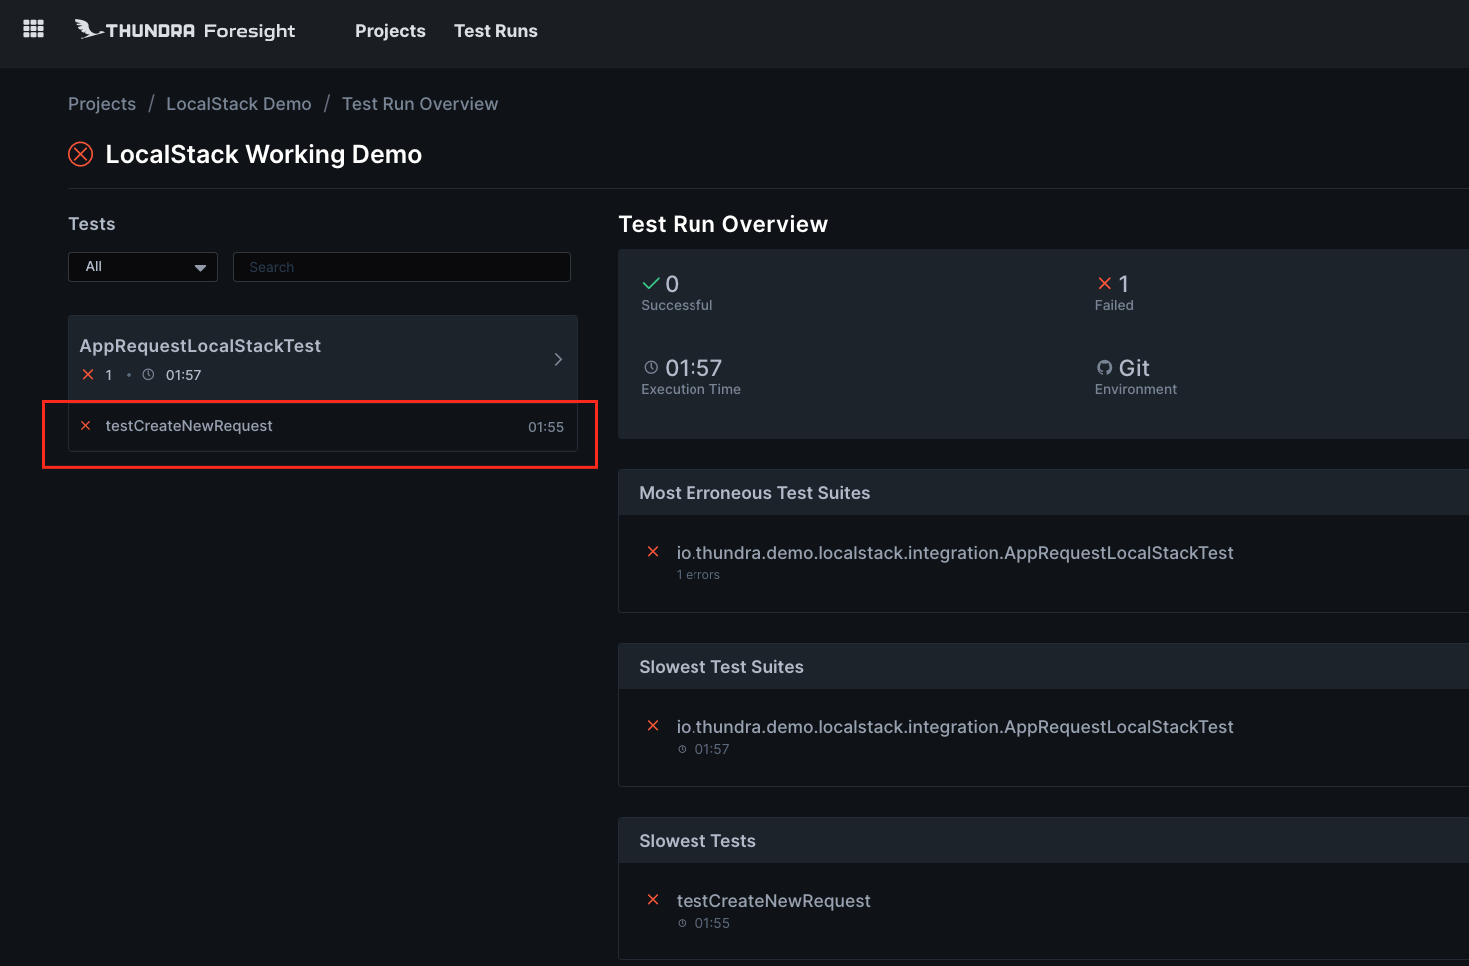
When you are on the test detail page, you can click the Trace Map button on the top right, it’ll open a window and will automatically redirect you to your invocations trace map. Here, we can see the whole flow, identical to what we’ve designed at the beginning of this post. We will also be able to tell where the error comes from.
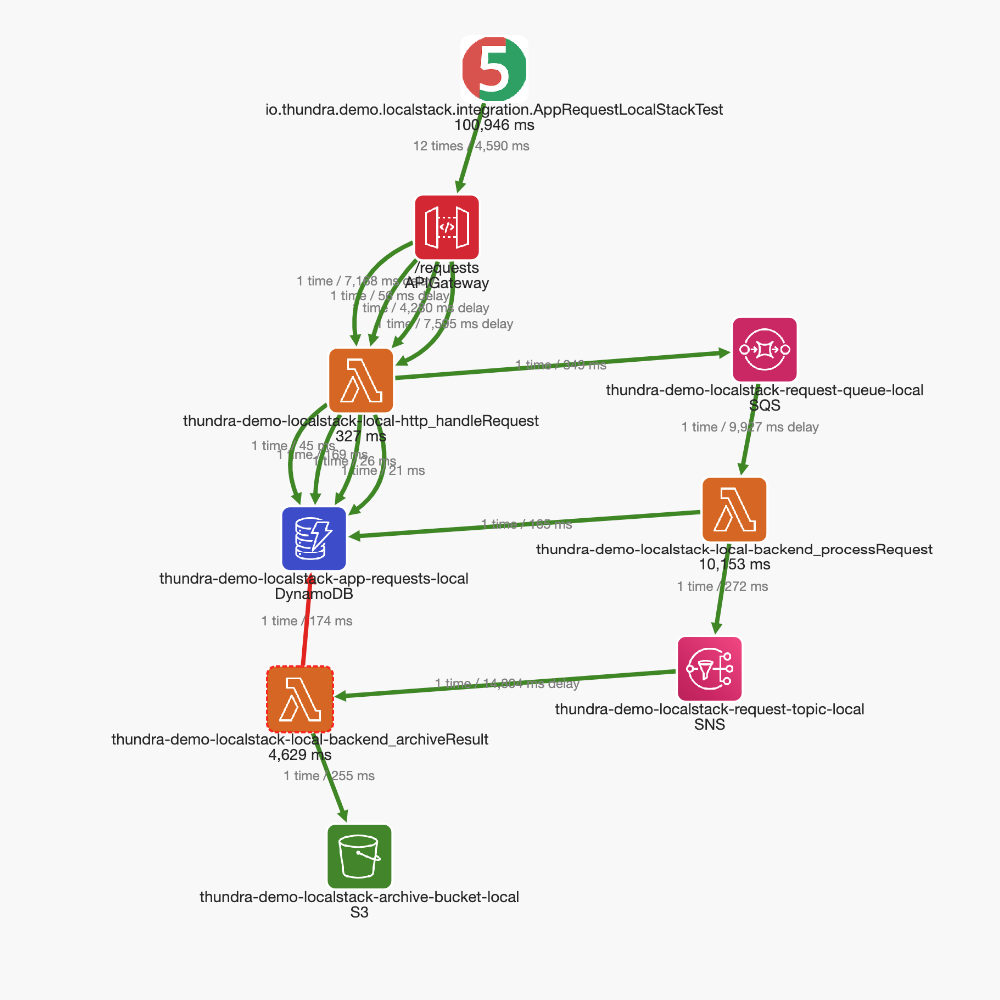
The red arrow that goes from our Lambda #3 to DynamoDB means there is a problem there. If we click on that, we’ll see a trace chart and summary of this request.
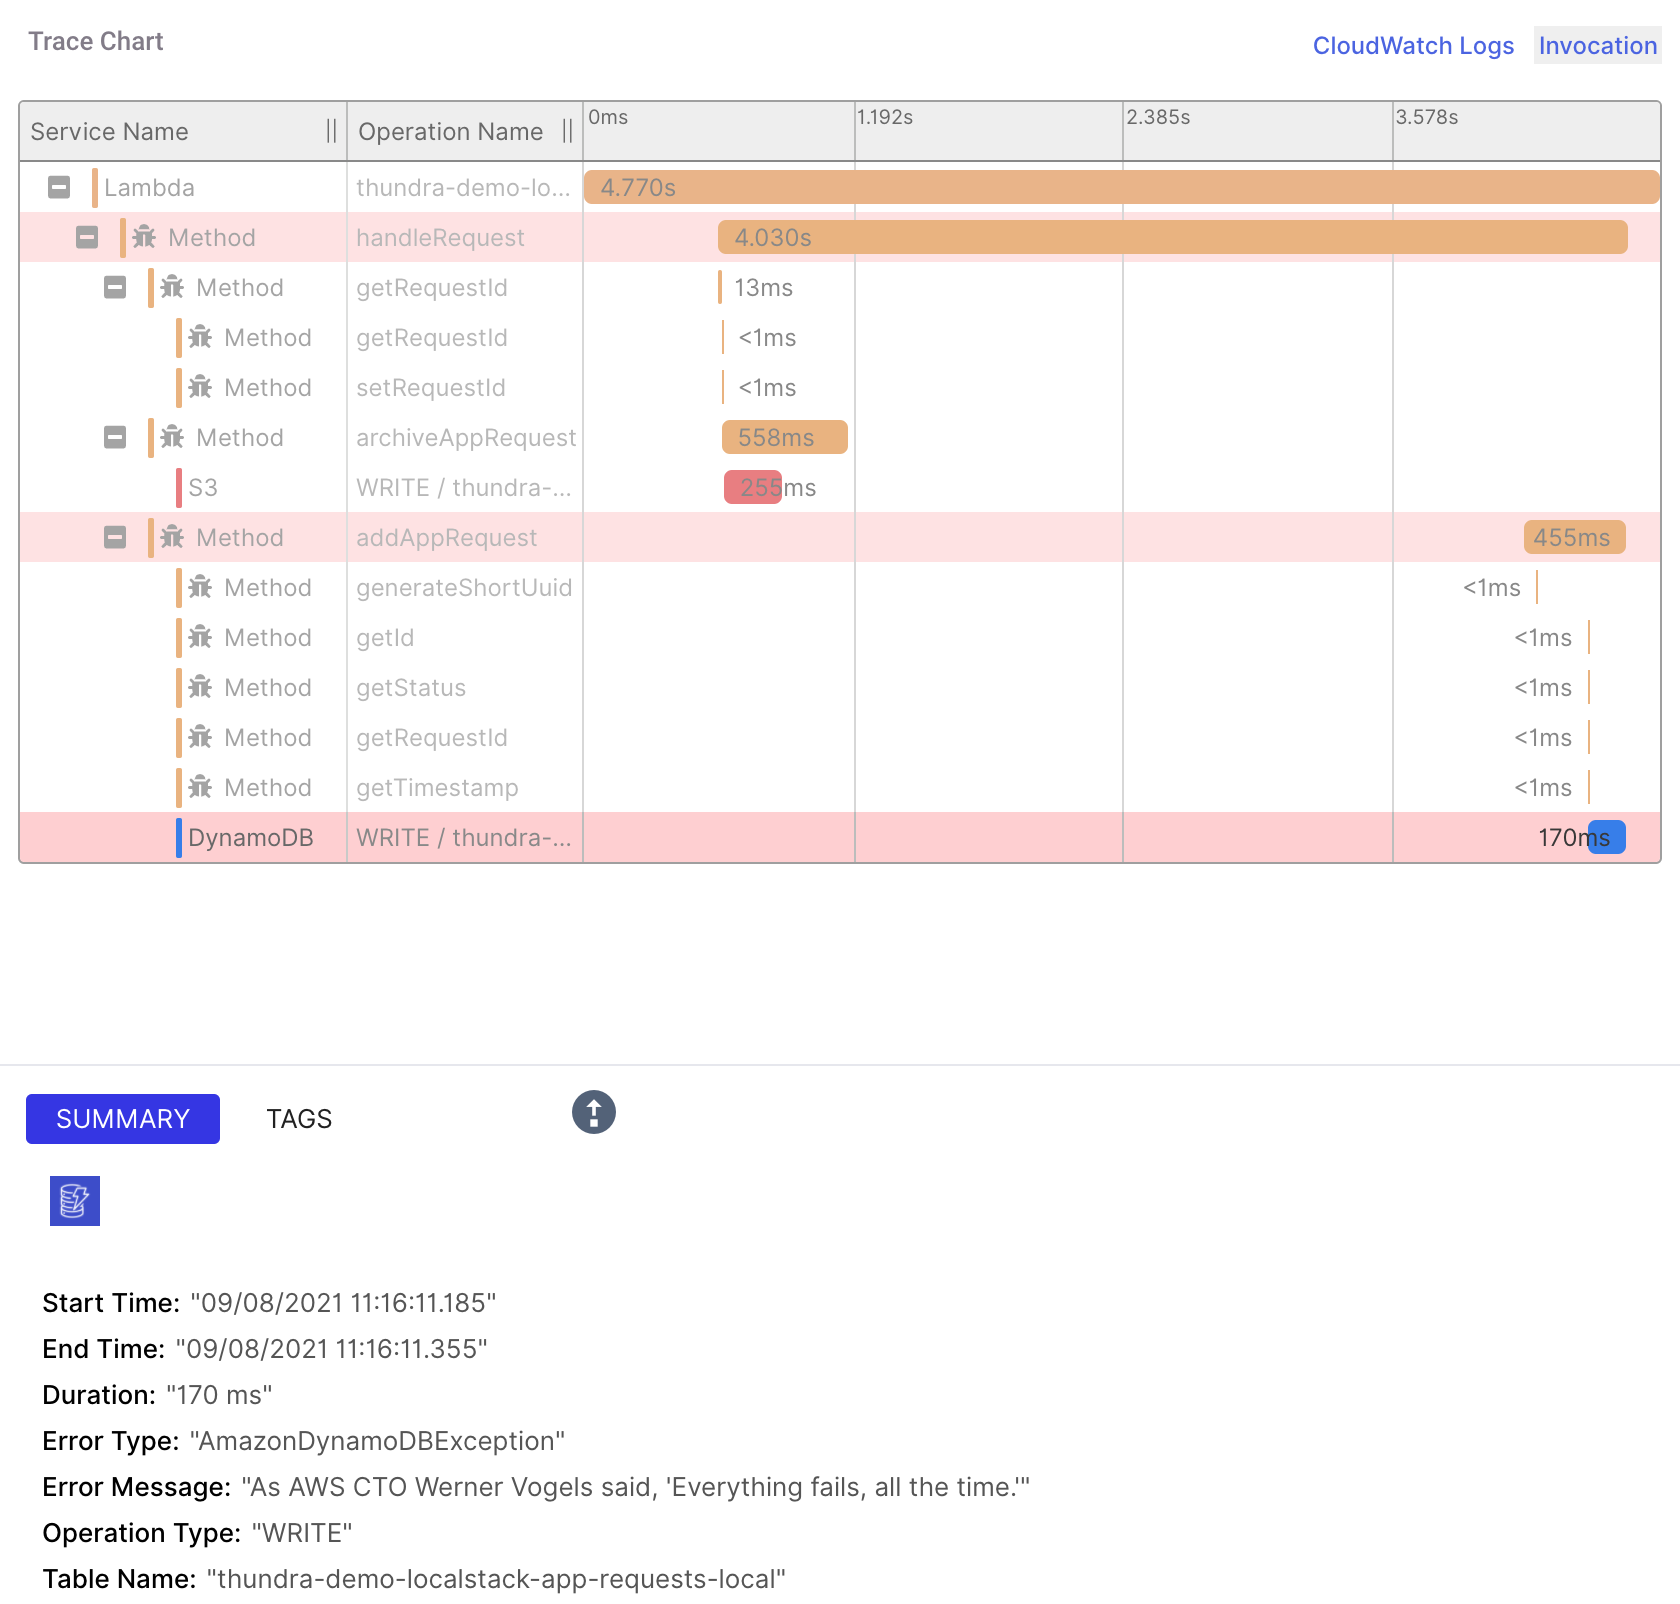
Hmm… An AmazonDynamoDBException and a message that says everything fails. Let’s click on that up-arrow and see what’s the source of this.
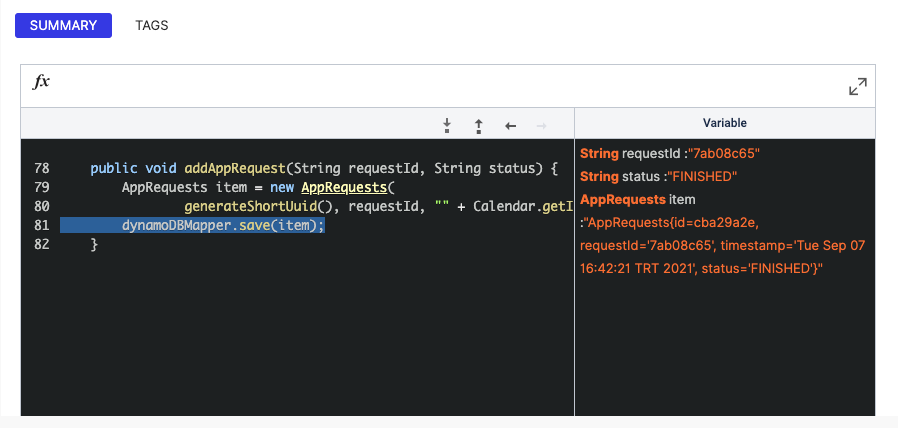
It looks like our addRequest method has failed when saving the item into our DynamoDB database. Let’s see our trace map again. If we click the JUnit 5 node on our map, we’ll see the whole trace chart for our test.
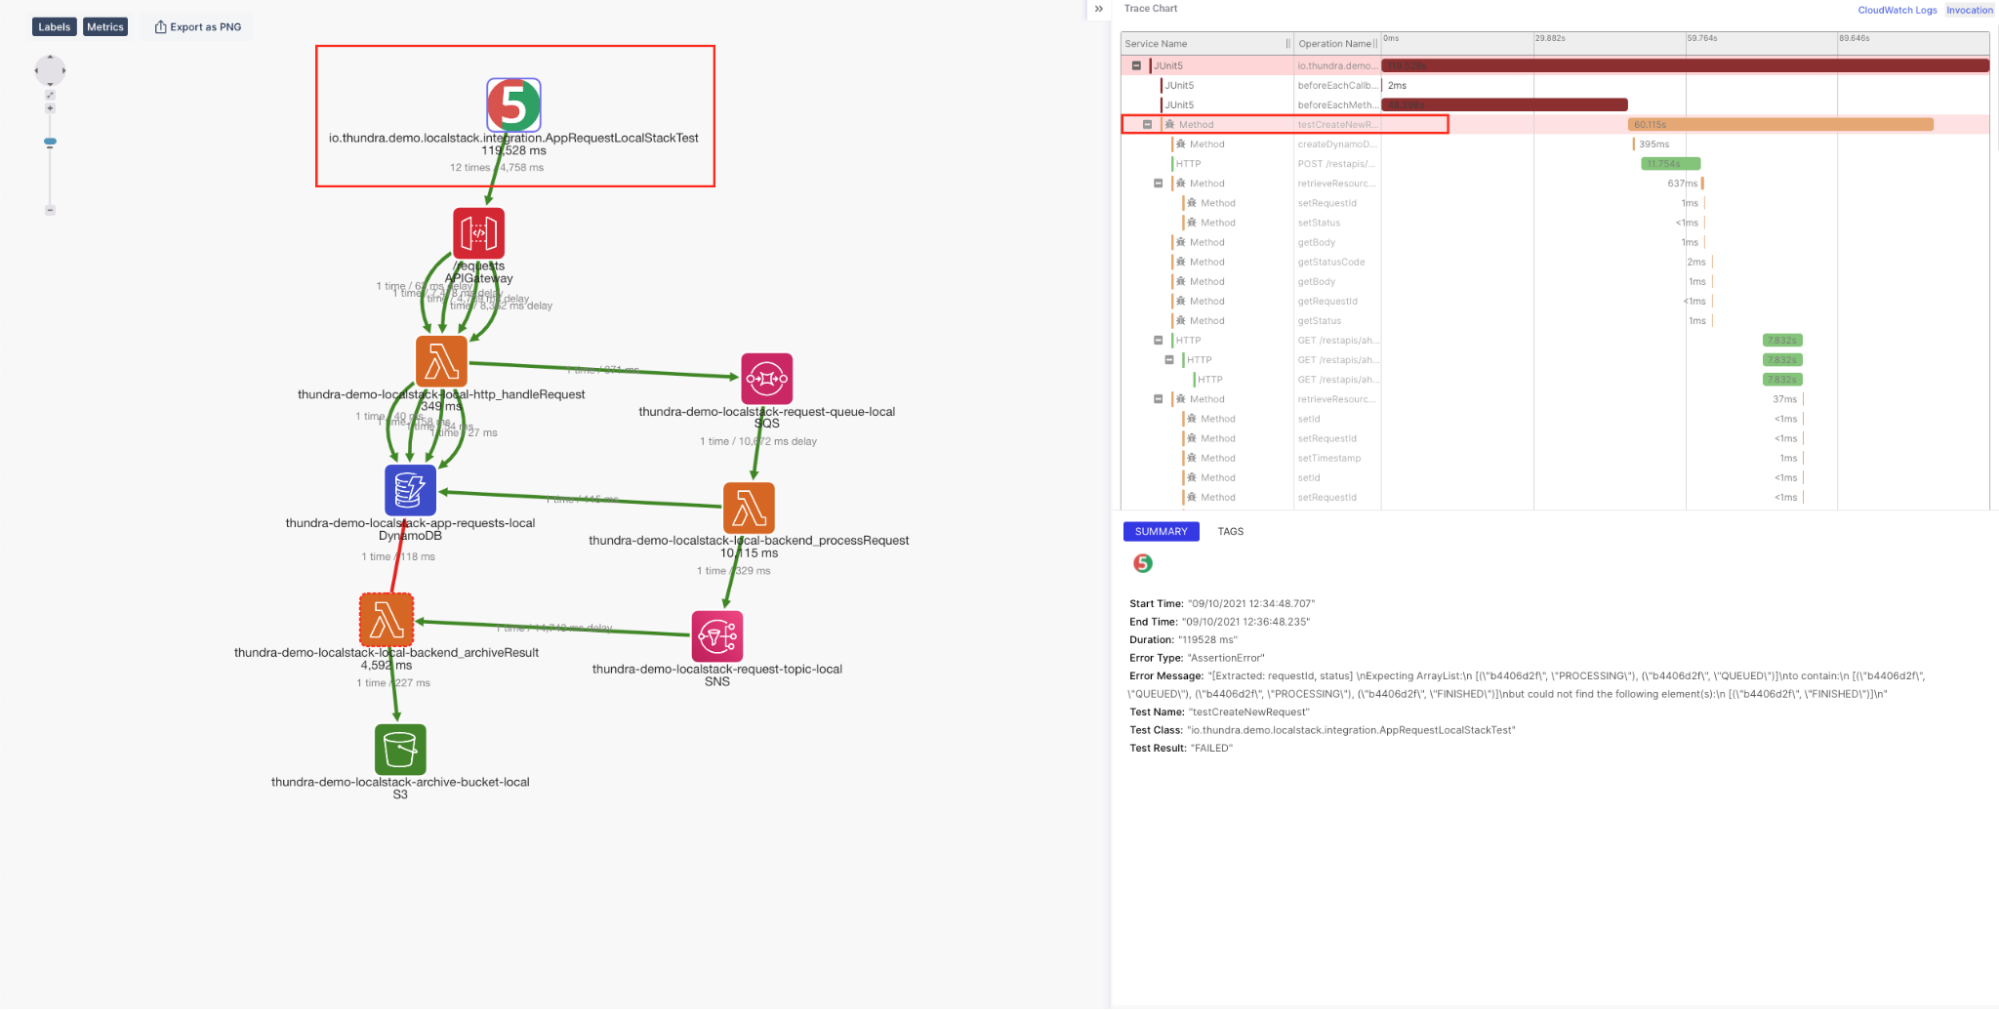
On the right hand side of the screen, we see the original assertion error and it’s method marked as red on the trace chart. Let’s click to that second red row.
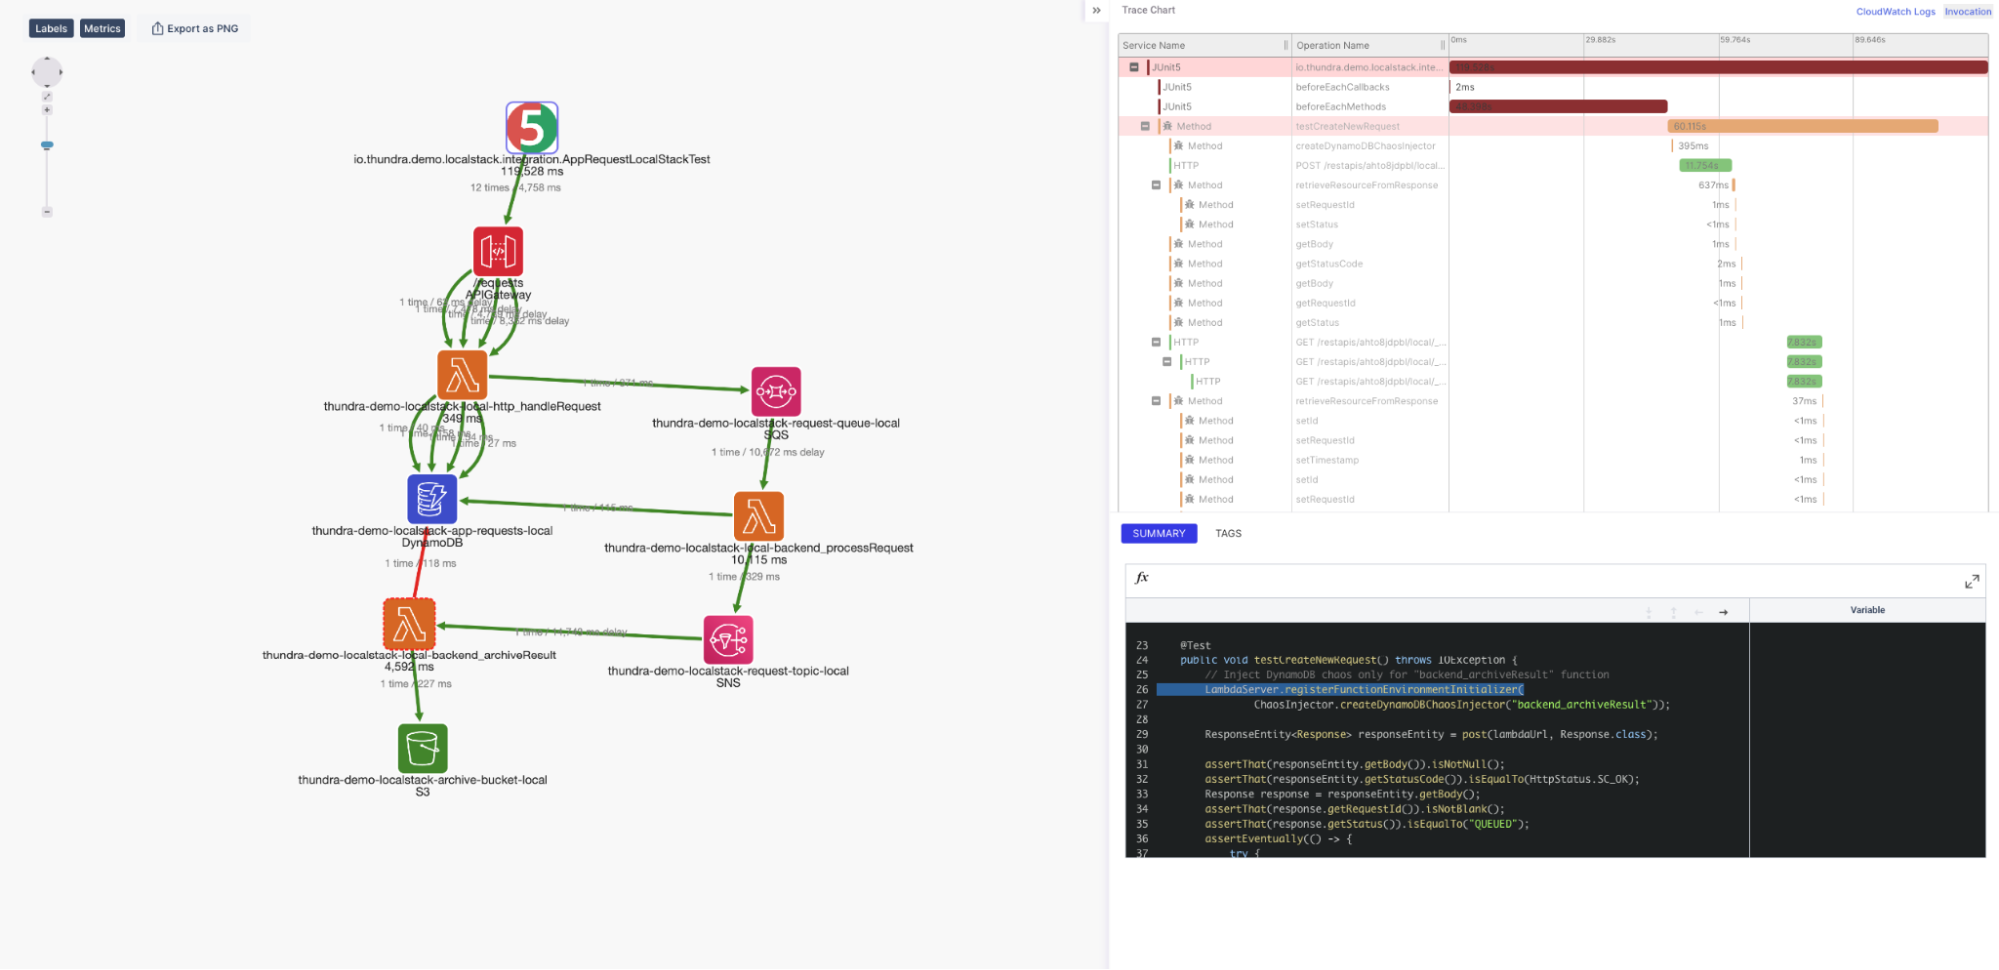
This opened our debugging window again. Now, let’s zoom in on that and play the execution until the end.
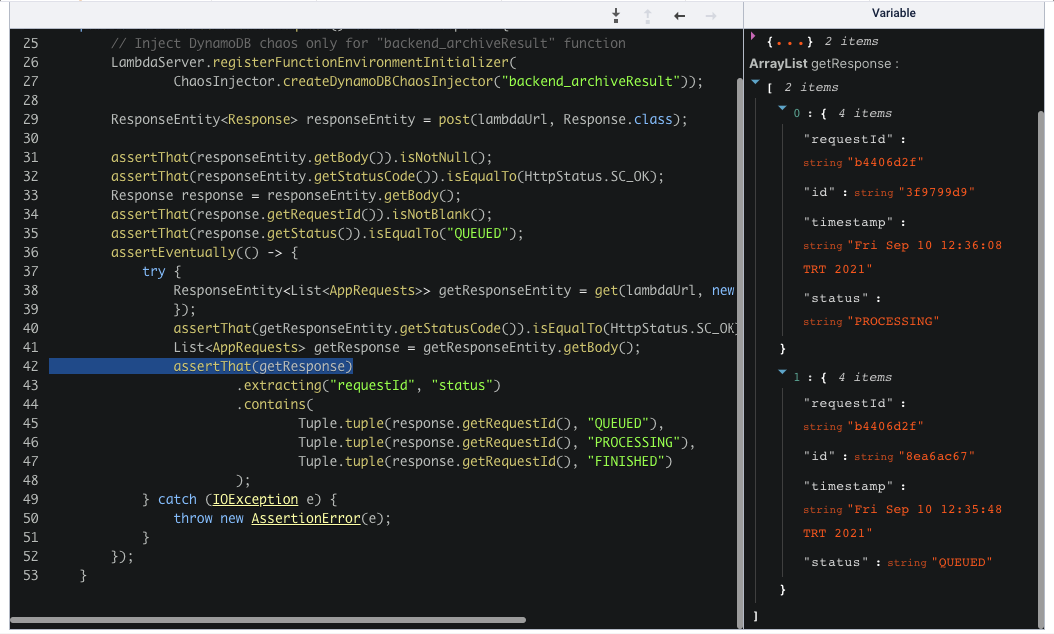
We can see that our getResponse list doesn’t have the FINISHED state as expected.
Now, we have some idea where our error originated and what variables were present at the time of the execution of our test. We call this Time Travel Debugging. With this instrumentation method, Thundra Agent will give you the ability to save your traces and play them line by line to debug your application and your tests.
Now, let’s see how we can fix this. But, as you might have guessed, there isn’t any bug in the code and the error is made up.
Or is it?
Chaos is the Answer
Well, usually developers write tests to ensure their application doesn’t break when they develop new features, fix bugs, or change anything in their codebase. Generally, this will give you a good estimate of how robust your application is. But not all errors come from our inability to write bug-free code.
Let’s face it. Some of the things we do feel like magic. There are a lot of things that can go wrong between your local environment and your production that we don’t understand at first sight. Even when you successfully push your code to production, things can still fail your efforts. A network partition, latency in the network where your code runs, or some disk failures… All of these could cost you a lot and this isn’t a perfect world. Some of these have already happened to you or might happen in the future. The best you can do is to be prepared for all of these as much as possible.
Purposefully injecting a bug, an exception, or latency might seem counterintuitive, but it’s better than the unexpected. This practice of doing a controlled experiment on your distributed system is called Chaos Engineering. At Thundra, we value the chaos, do our best to be prepared for the unexpected and we want our customers to be the same, if not more. By using Thundra Agent in your project, you’ll have the capability to engineer your own chaos experiment for your applications and your tests.
So, that’s what we did here. If you go to the following file, you’ll see that we’ve implemented a class for chaos injection and injected an error to our Lambda #3.

To fix the error, we can simply comment out these lines. Let’s run the tests again and see our tests become successful.
[INFO] Tests run: 1, Failures: 0, Errors: 0, Skipped: 0, Time elapsed: 102.819 s - in io.thundra.demo.localstack.integration.AppRequestLocalStackTest[INFO][INFO] Results:[INFO][INFO] Tests run: 1, Failures: 0, Errors: 0, Skipped: 0[INFO][INFO] ------------------------------------------------------------------------[INFO] BUILD SUCCESS[INFO] ------------------------------------------------------------------------[INFO] Total time: 02:04 min[INFO] Finished at: 2021-09-07T18:01:22+03:00[INFO] ------------------------------------------------------------------------In addition to application-level chaos engineering with Thundra, we can also inject errors at the infrastructure level with LocalStack - for example, injecting Kinesis stream errors by configuring KINESIS_ERROR_PROBABILITY=0.8. But let’s not go into too much detail here - we’ll cover that in a separate blog post!
Optimizations and Thundra Lambda Server
When dealing with Lambdas, cold starts and feedback loops are always an issue whether you are on cloud or on your local. Thundra Agent comes with a lot of powerful utilities to minimize this tiresome cycle and helps you develop and debug your code faster and easier.
When you check the codes for this project, especially the LocalStackTest.java file, you’d see that we’re calling make start-embedded before each test. We’re simply forwarding all the Lambda invocations to the built-in Lambda server inside Thundra Agent. With this configuration, your cold starts and deployment time decreases substantially.
This will also affect the overall test time. A simple comparison is shown below.
Test Execution Time (min) -------------start 2.53start-embedded 1.44---------------------------------------We hope to cover this feature in more detail in the future.
Summary and Next Steps
Summing up; LocalStack users can now have a granular view of their tests by plugging in Thundra Foresight with the demonstrated easy steps.
Foresight brings the power of observability that we have for production workloads into the tests for LocalStack users. If you want to learn more about how the integration works, you can check the documentation here.
You can signup for Thundra and integrate your open source project for “free forever and with full functionality”.


