Debug Lambda functions from your IDE using LocalStack
LocalStack makes it easier to develop, test & debug your Lambda functions locally. Learn how you can attach a debugger to your Lambda function from your IDE using LocalStack.

In the previous blog, we checked out how to hot-swap Lambda functions locally using LocalStack. Using LocalStack, you can execute your Lambda functions locally without the need to deploy them to AWS. This is a great way to test your code and learn more about how your Lambda functions work before deploying them to AWS. But there is always a question about debugging the Lambda functions from your IDE before deploying it. This is a tricky problem because, with hot reload, you would have to invoke your Lambda function multiple times to figure out where the bug is, and we don’t have a proper way to set breakpoints in our debugger to inspect the code later on.
To solve this, LocalStack features local Lambda debugging supported on various Integrated Development Environments (IDEs) like VS Code, IntelliJ, PyCharm and more. With local Lambda debugging, you can quickly debug your Lambda functions by setting breakpoints, while your local code mounting allows you to validate your changes instantly. This workflow aims to significantly improve your Lambda development & testing experience with LocalStack, where you can test your code on every change without having to deploy it on AWS or even re-running your deployment scripts.
This blog will look over how you can debug your Python, and JVM Lambda functions from VS Code. You will also see how to configure your local IDE for local debugging and make the best use of LocalStack’s functionality for Lambda debugging and testing.
Configuring LocalStack for Python debugging
In this blog, we already presume that you have installed LocalStack and tried running it locally at least once. If not, you can install LocalStack using the following command via pip:
pip install localstackThi will install the localstack-cli, which runs the Docker image that hosts the LocalStack runtime. You will also need a LocalStack account and Auth Token. You can sign up for a free account and then configure your Auth Token:
localstack auth set-token <your-auth-token>To ensure that we can use the remote debugging feature, we need to start LocalStack using specific configuration options. These are detailed on our Lambda configuration page. Copy the following command into your terminal:
LAMBDA_REMOTE_DOCKER=0 \LAMBDA_DOCKER_FLAGS='-p 19891:19891' \DEBUG=1 localstack start -dThe LAMBDA_REMOTE_DOCKER option is set to 0 (deactivated) to ensure that the Lambda volume mounts work while we are mounting a temporary folder on the host. The LAMBDA_DOCKER_FLAGS defines a Docker flag that exposes port 19891 for debugging the Lambda handler code that will run inside the container.
You will also need to install our LocalStack AWS CLI, which is a thin wrapper around the aws command line interface for use with LocalStack, using pip:
pip install awscli-localConfiguring the code for remote debugging
After setting up LocalStack and launching it in detached mode, we can now configure the debug server using debugpy. debugpy is an implementation of the Debug Adapter Protocol for Python 3 and is used for debugging on VS Code. debugpy implements all of the standard debugging tools you would expect and provides a standardised way for development tools to communicate with debuggers.
To enable debugpy inside the Lambda function, you need to place the following block of code inside the handler code:
import debugpydebugpy.listen(19891)debugpy.wait_for_client()The wait_for_client() function blocks execution until client is attached. You can also use the wait_for_debug_client function which implements the start of the debug server and also adds an automatic cancellation of the wait task if the debug client (i.e. VSCode) doesn’t connect.
Please note that in the code snippet below we assume that the debugpy package has been installed into a virtualenv folder named .venv inside the same directory where the Lambda handler (handler.py) is stored on the local disk (see further below). Hence, adding .venv/lib/python*/site-packages to the Python system path ensures that debugpy is available to the Lambda handler execution at runtime.
def wait_for_debug_client(timeout=15):    """Utility function to enable debugging with Visual Studio Code"""    import time, threading    import sys, glob    sys.path.append(glob.glob(".venv/lib/python*/site-packages")[0])    import debugpy
    debugpy.listen(("0.0.0.0", 19891))    class T(threading.Thread):        daemon = True        def run(self):            time.sleep(timeout)            print("Canceling debug wait task ...")            debugpy.wait_for_client.cancel()    T().start()    print("Waiting for client to attach debugger ...")    debugpy.wait_for_client()
Creating a Python Lambda function
For the purpose of this blog, we will use a simple AWS Lambda function which will just wait for the debugger to be attached and print the invocation event:
def handler(event, context):    """Lambda handler that will get invoked by the LocalStack runtime"""
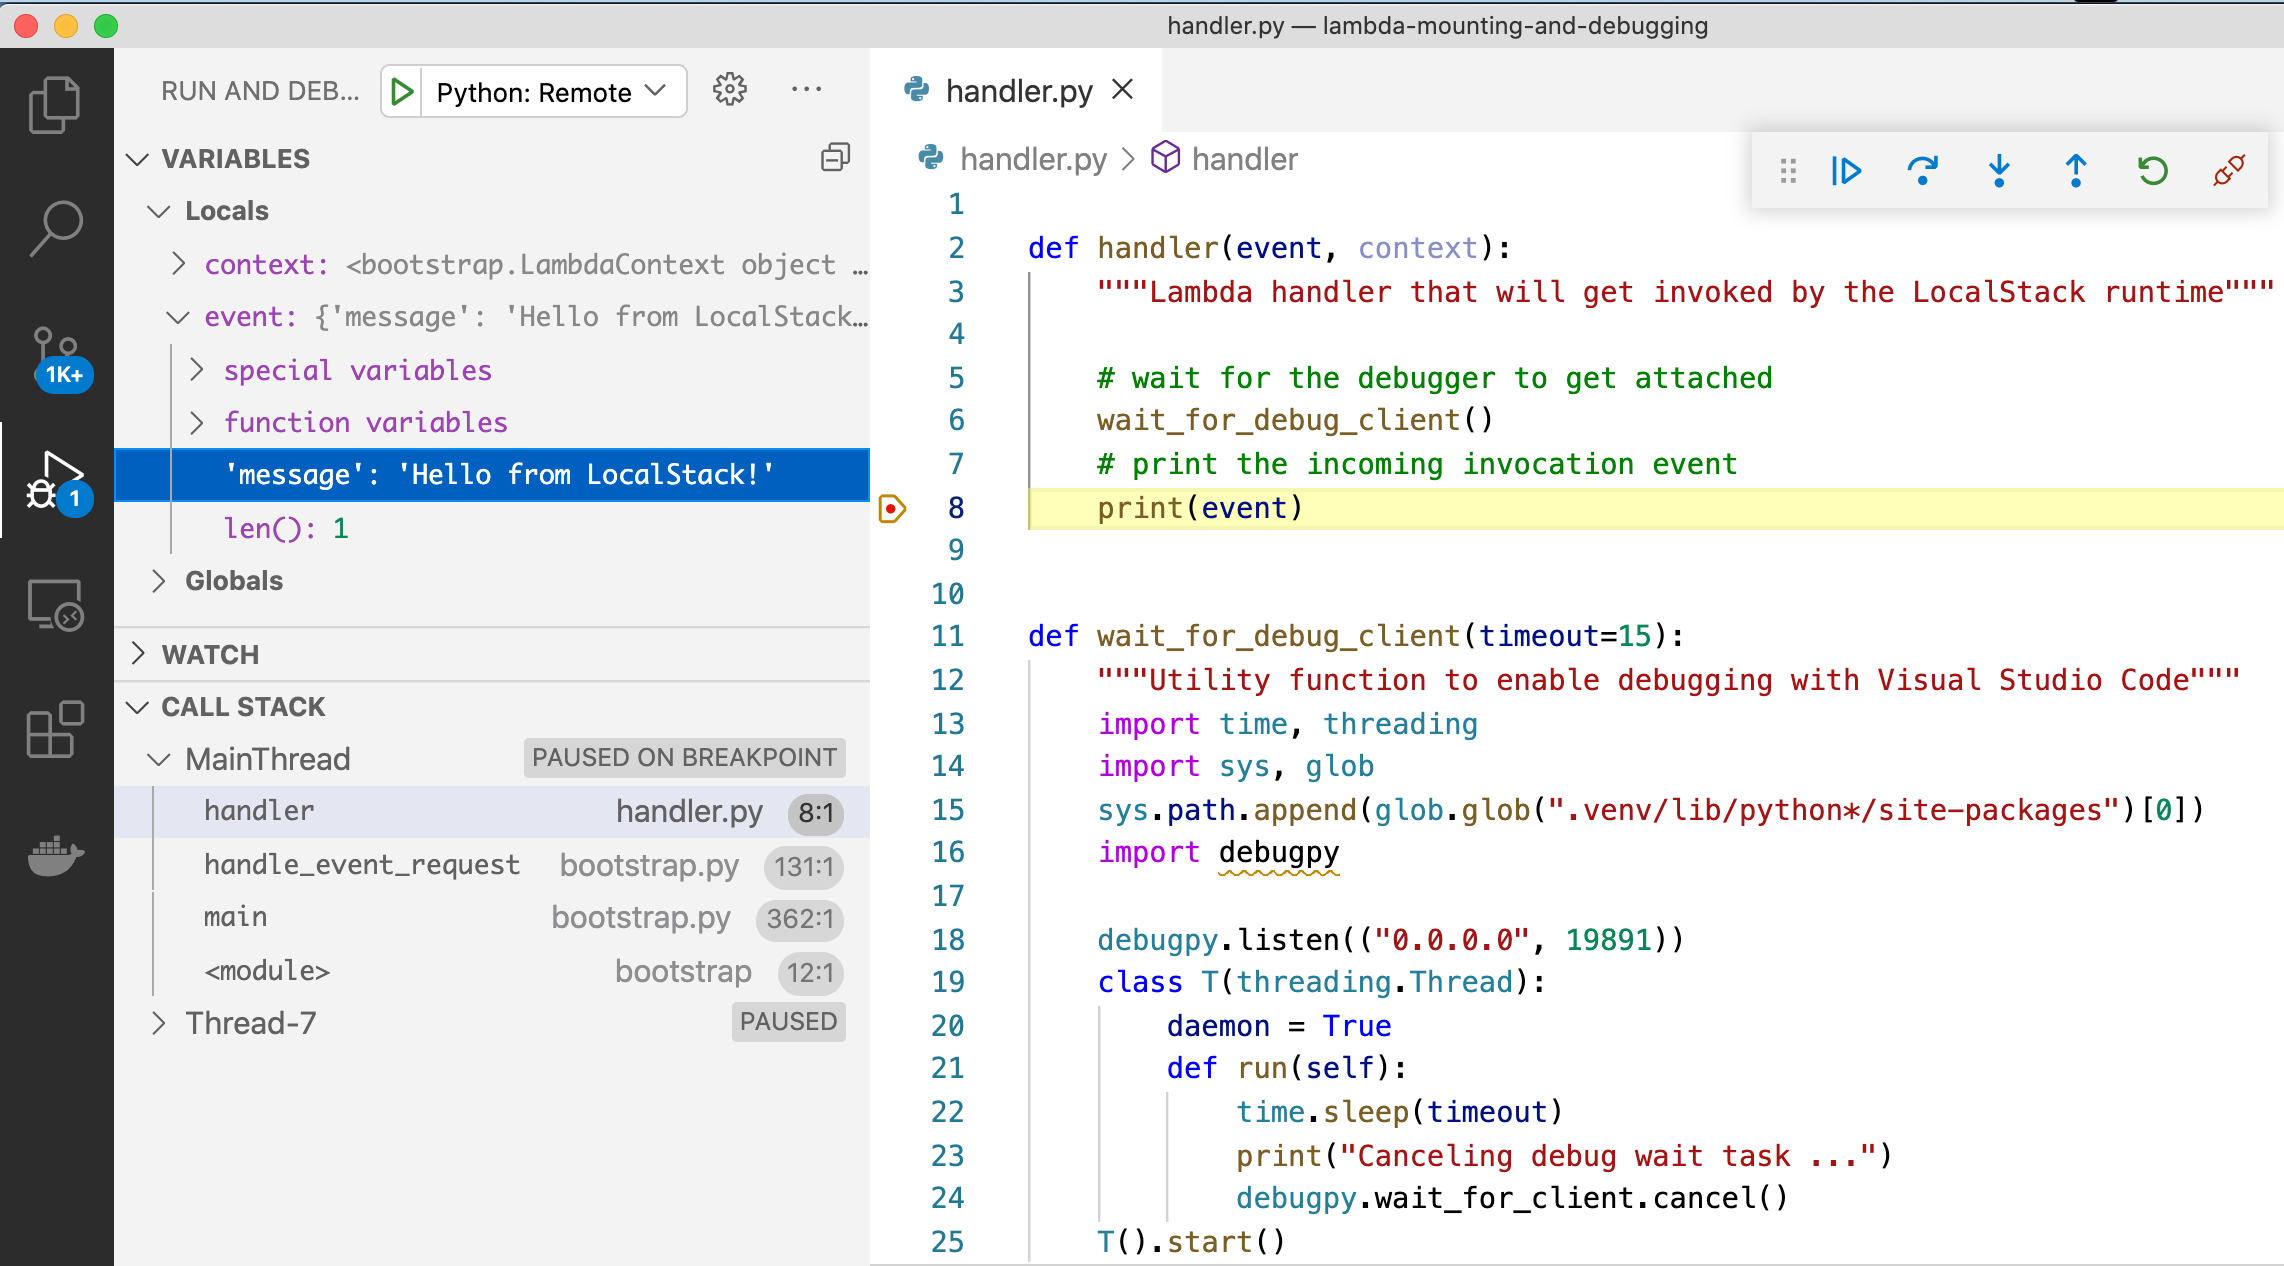
    # wait for the debugger to get attached    wait_for_debug_client()    # print the incoming invocation event    print(event)

def wait_for_debug_client(timeout=15):    """Utility function to enable debugging with Visual Studio Code"""    import time, threading    import sys, glob    sys.path.append(glob.glob(".venv/lib/python*/site-packages")[0])    import debugpy
    debugpy.listen(("0.0.0.0", 19891))    class T(threading.Thread):        daemon = True        def run(self):            time.sleep(timeout)            print("Canceling debug wait task ...")            debugpy.wait_for_client.cancel()    T().start()    print("Waiting for client to attach debugger ...")    debugpy.wait_for_client()

if __name__ == "__main__":    handler({}, {})
To start debugging, we first need to create the Lambda function on LocalStack. We will deploy the Lambda using a unique S3 bucket indicated by __local__ as the bucket name.
The S3 key path should point to the directory of your Lambda function code. You can save the above example as a file in a directory of your choice. The handler is referenced by the filename of your Lambda function, where the code inside of it is invoked. Copy and paste the following command in your terminal:
awslocal lambda create-function --function-name my-cool-local-function \ --code S3Bucket="__local__",S3Key="$(pwd)/" \ --handler handler.handler \ --runtime python3.8 \ --role cool-stacklifterWe can test the above Lambda function by invoking it with a payload:
awslocal lambda invoke --function-name my-cool-local-function --payload '{"message": "Hello from LocalStack!"}' output.txtConfiguring Visual Studio Code for Python Lambda debugging
For attaching the debug server from Visual Studio Code, you need to add a run configuration. The run view displays all the information related to running and debugging with a top bar which has all the debugging commands and configuration settings. Create a launch.json file in the .vscode directory of your project and add the following:
{ "version": "0.2.0", "configurations": [ { "name": "Python: Remote Attach", "type": "python", "request": "attach", "connect": { "host": "localhost", "port": 19891 }, "pathMappings": [ { "localRoot": "${workspaceFolder}", "remoteRoot": "." } ] } ]}You have about 15 seconds to switch to Visual Studio Code and run the preconfigured remote debugger with the above function. This timeout is configurable, and now you can set a breakpoint in the Lambda handler code first, which can then later be inspected.
Here is our Lambda debugger in action:

Configuring LocalStack for JVM debugging
To configure LocalStack for JVM debugging, you would need to set the LAMBDA_JAVA_OPTS with jdwp settings and expose the debug port of your choice. Over a docker-compose.yml, you can do that via:
services: localstack: ... environment: ... - LAMBDA_JAVA_OPTS=-agentlib:jdwp=transport=dt_socket,server=y,suspend=y,address=*:5050 - LAMBDA_DOCKER_FLAGS=-p 127.0.0.1:5050:5050The suspend=y option delays the code execution until debugger is attached to debugger server. To change the behavior, turn it to suspend=n.
Configuring Visual Studio Code for JVM Lambda debugging
To configure Visual Studio Code, for JVM Lambda debugging, we need to install the Language support for Java and Debugger for Java extensions. Create a new .vscode/tasks.json file, if not already present, and add a new task to it:
{ "version": "2.0.0", "tasks": [ { "label": "Wait Remote Debugger Server", "type": "shell", "command": "while [[ -z $(docker ps | grep :5050) ]]; do sleep 1; done; sleep 1;" } ]}Create a new launch.json file or edit an existing one from the Run and Debug tab, then add the following configuration:
{ "version": "0.2.0", "configurations": [ { "type": "java", "name": "Remote JVM on LS Debug", "projectRoot": "${workspaceFolder}", "request": "attach", "hostName": "localhost", "preLaunchTask": "Wait Remote Debugger Server", "port": 5050 } ]}To debug your lambda function, click on the Debug icon with Remote JVM on LS Debug configuration selected, and then invoke your Lambda function.
Conclusion
Debugging your Lambda function with LocalStack in your IDE is a great way to enable quick feedback cycles, and to test and validate your code logic before pushing it to production. Since you have already mounted the local Lambda function from your local filesystem into the Lambda container, LocalStack would immediately reflect the changes in the above section. Here is an example where you change the implementation of the handler as follows:
def handler(event, context):    """Lambda handler that will get invoked by the LocalStack runtime"""
    # wait for the debugger to get attached    wait_for_debug_client()    # print the incoming invocation event    print(event)
    # additional line added below:    print("!! Additional log output !!")
Upon the following invocation of the Lambda, the additional print output will immediately appear in the Lambda logs. This allows for a quick development & debug loop without the need to redeploy the Lambda after the handler is changed! However, due to the ports used by the debugger, you can currently only debug one Lambda at a time, due to which multiple concurrent invocations will not work.
Find the Lambda Code Mounting & Debugging code on our LocalStack Samples. You can connect with us on LocalStack Slack to get help.


