Debug AWS Lambda Functions Locally Using LocalStack’s Lambda Debug Mode
Learn how to debug AWS Lambda functions locally using LocalStack’s Lambda Debug Mode with lifted timeouts, hot reload, and full step-through debugging in VS Code.

UPDATE: We’ve released a new, simplified way to debug Lambda functions locally using a dedicated localstack AWS profile. The new approach replaces the manual credential setup shown below.
Introduction
Debugging AWS Lambda functions locally is difficult due to the stateless, event-driven nature of serverless environments and their short execution timeouts. LocalStack’s Lambda Debug Mode changes that by enabling full remote debugging with lifted timeouts, allowing developers to inspect their code step-by-step using familiar tools like VS Code.
In this tutorial, we’ll walk through three common use cases for debugging Lambda functions locally:
- Debug a Lambda function locally
- Debug a Lambda function with multiple concurrent invocations
- Debug two Lambda functions locally
Key Concepts
Lambda Debug Mode simplifies the process of debugging AWS Lambda functions locally.
The process involves two main parts: first, enabling the mode globally with the LAMBDA_DEBUG_MODE=1 flag (which automatically extends timeouts), and second, configuring specific debugger settings (like unique ports) for each function you want to debug, typically using a YAML configuration file.
This file allows you to automate configuration steps that previously required manual setup. It extends timeouts, enables debugger attachment, and supports per-function configuration for debugger attachment.
Enable Debug Mode
Start LocalStack with the LAMBDA_DEBUG_MODE environment variable set to 1:
LAMBDA_DEBUG_MODE=1 localstack startThis turns on debug mode globally and updates timeouts for debugging:
- Container startup timeout: Increased to allow debugger connection before failure.
- Lambda execution timeout: Extended to avoid ending long debug sessions early.
- API Gateway integration timeout: Synced with Lambda timeout to prevent errors.
Debug Port Configuration
To control debugging per function or set custom ports, use the Lambda Debug Mode config file (lambda_debug_mode_config.yaml). It replaces older methods like setting LAMBDA_DOCKER_FLAGS and supports organized, per-function settings. Here’s an example of the config file:
functions: - arn: arn:aws:lambda:us-east-1:000000000000:function:my-lambda debug-port: 5678Each entry in the configuration file must use the full Lambda ARN, as the debugger settings are linked directly to that specific resource identifier. This file enables per-function debugger settings.
Importantly, this configuration is dynamic: you can modify the file (adding/removing functions or changing ports) while LocalStack is running, and the changes will be applied automatically without requiring a restart.
Mount the Config
To use the configuration file, you need to mount it into the LocalStack container and tell LocalStack where to find it using environment variables and volume mount:
LOCALSTACK_LAMBDA_DEBUG_MODE=1 \LOCALSTACK_LAMBDA_DEBUG_MODE_CONFIG_PATH=/tmp/lambda_debug_mode_config.yaml \localstack start --volume /path/to/your/debug-config.yaml:/tmp/lambda_debug_mode_config.yamlNote: Replace
/path/to/your/debug-config.yamlwith the actual path on your host machine.
Hot Reload setup
While debugging the Lambda functions, it is recommended to use LocalStack’s special Hot Reload setup. This works by specifying hot-reload as a special S3 bucket name in the --code parameter, instructing LocalStack to mount the local directory (specified by S3Key) into the Lambda container.
awslocal lambda create-function \ ... --code "S3Bucket=hot-reload,S3Key=$(pwd)/" \ # Mounts the current directory ...Code changes are then immediately reflected, eliminating the need for redeploying the Lambda function after every change.
Notes
- Set a unique
debug-portfor each function in the config file to prevent port conflicts and allow parallel debugging. - LocalStack auto-detects config file changes, so you can update ports or settings without restarting the container.
- Lambda containers in debug mode stop automatically after the session ends, freeing system resources.
Debug a Single Lambda function
In this beginner scenario, we’ll walk through debugging a Python Lambda function locally using LocalStack’s Lambda Debug Mode. We’ll deploy a Lambda function with a one-second timeout—which is automatically lifted when Debug Mode is enabled.
1.1: Create Lambda function
Start by creating a new file named handler.py and adding the following Lambda handler function:
def handler(event, context):    # Wait for the debugger to get attached.    wait_for_debug_client()
    # Print the incoming invocation event.    print(event)
    # Return the incoming invocation event.    return event
The wait_for_debug_client() function initializes a debug server using debugpy. It allows time for a debugger (e.g., Visual Studio Code) to connect, and cancels the wait if no client attaches.
Here’s the full implementation:
def wait_for_debug_client(timeout=3600):    """Utility function to enable debugging with Visual Studio Code"""    import time, threading    import sys, glob    sys.path.append(glob.glob(".venv/lib/python*/site-packages")[0])    import debugpy
    debugpy.listen(("0.0.0.0", 19891))    class T(threading.Thread):        daemon = True        def run(self):            time.sleep(timeout)            print("Canceling debug wait task ...")            debugpy.wait_for_client.cancel()    T().start()    print("Waiting for client to attach debugger ...")    debugpy.wait_for_client()
if __name__ == "__main__":    handler({}, {})
The full source file is also available in the repository.
1.2 Configure Lambda Debug Mode
Next, create a file named lambda_debug_mode_config.yaml to configure debugging for your function:
functions: arn:aws:lambda:us-east-1:000000000000:function:function-one: debug-port: 19891This maps the function function-one to port 19891, which your debugger will connect to.
Start LocalStack with Lambda Debug Mode enabled and mount the configuration file into the container:
LOCALSTACK_LAMBDA_DEBUG_MODE=1 \LOCALSTACK_LAMBDA_DEBUG_MODE_CONFIG_PATH=/tmp/lambda_debug_mode_config.yaml \localstack start --volume $PWD/lambda_debug_mode_config.yaml:/tmp/lambda_debug_mode_config.yaml1.3: Set Up VS Code Debug Configuration
Now configure VS Code to attach to the Lambda function at runtime. In your project, create a .vscode directory and add a file named launch.json with the following content:
{ "version": "0.2.0", "configurations": [ { "name": "Python: Remote Attach", "type": "debugpy", "request": "attach", "connect": { "host": "localhost", "port": 19891 }, "pathMappings": [ { "localRoot": "${workspaceFolder}", "remoteRoot": "." } ] } ]}After deploying and invoking the Lambda function, you’ll use this configuration to connect the debugger.
1.4: Deploy Lambda function
Install the required dependencies for your function—specifically debugpy—using virtualenv or your preferred Python environment manager:
virtualenv .venvsource .venv/bin/activatepip3 install debugpyNow deploy the Lambda function using awslocal, a CLI wrapper over the AWS CLI:
awslocal lambda create-function \ --function-name function-one \ --timeout 1 \ --code "S3Bucket=hot-reload,S3Key=$(pwd)/" \ --handler handler.handler \ --role arn:aws:iam::000000000000:role/test-role \ --runtime python3.12Note: We are intentionally setting a short timeout of 1 second (
--timeout 1) to show that Lambda Debug Mode overrides it and provides enough time for debugging.
This example uses LocalStack’s special Hot Reload setup, as described earlier. Wait for the function to become active:
awslocal lambda wait function-active-v2 --function-name function-one1.5: Start debugging
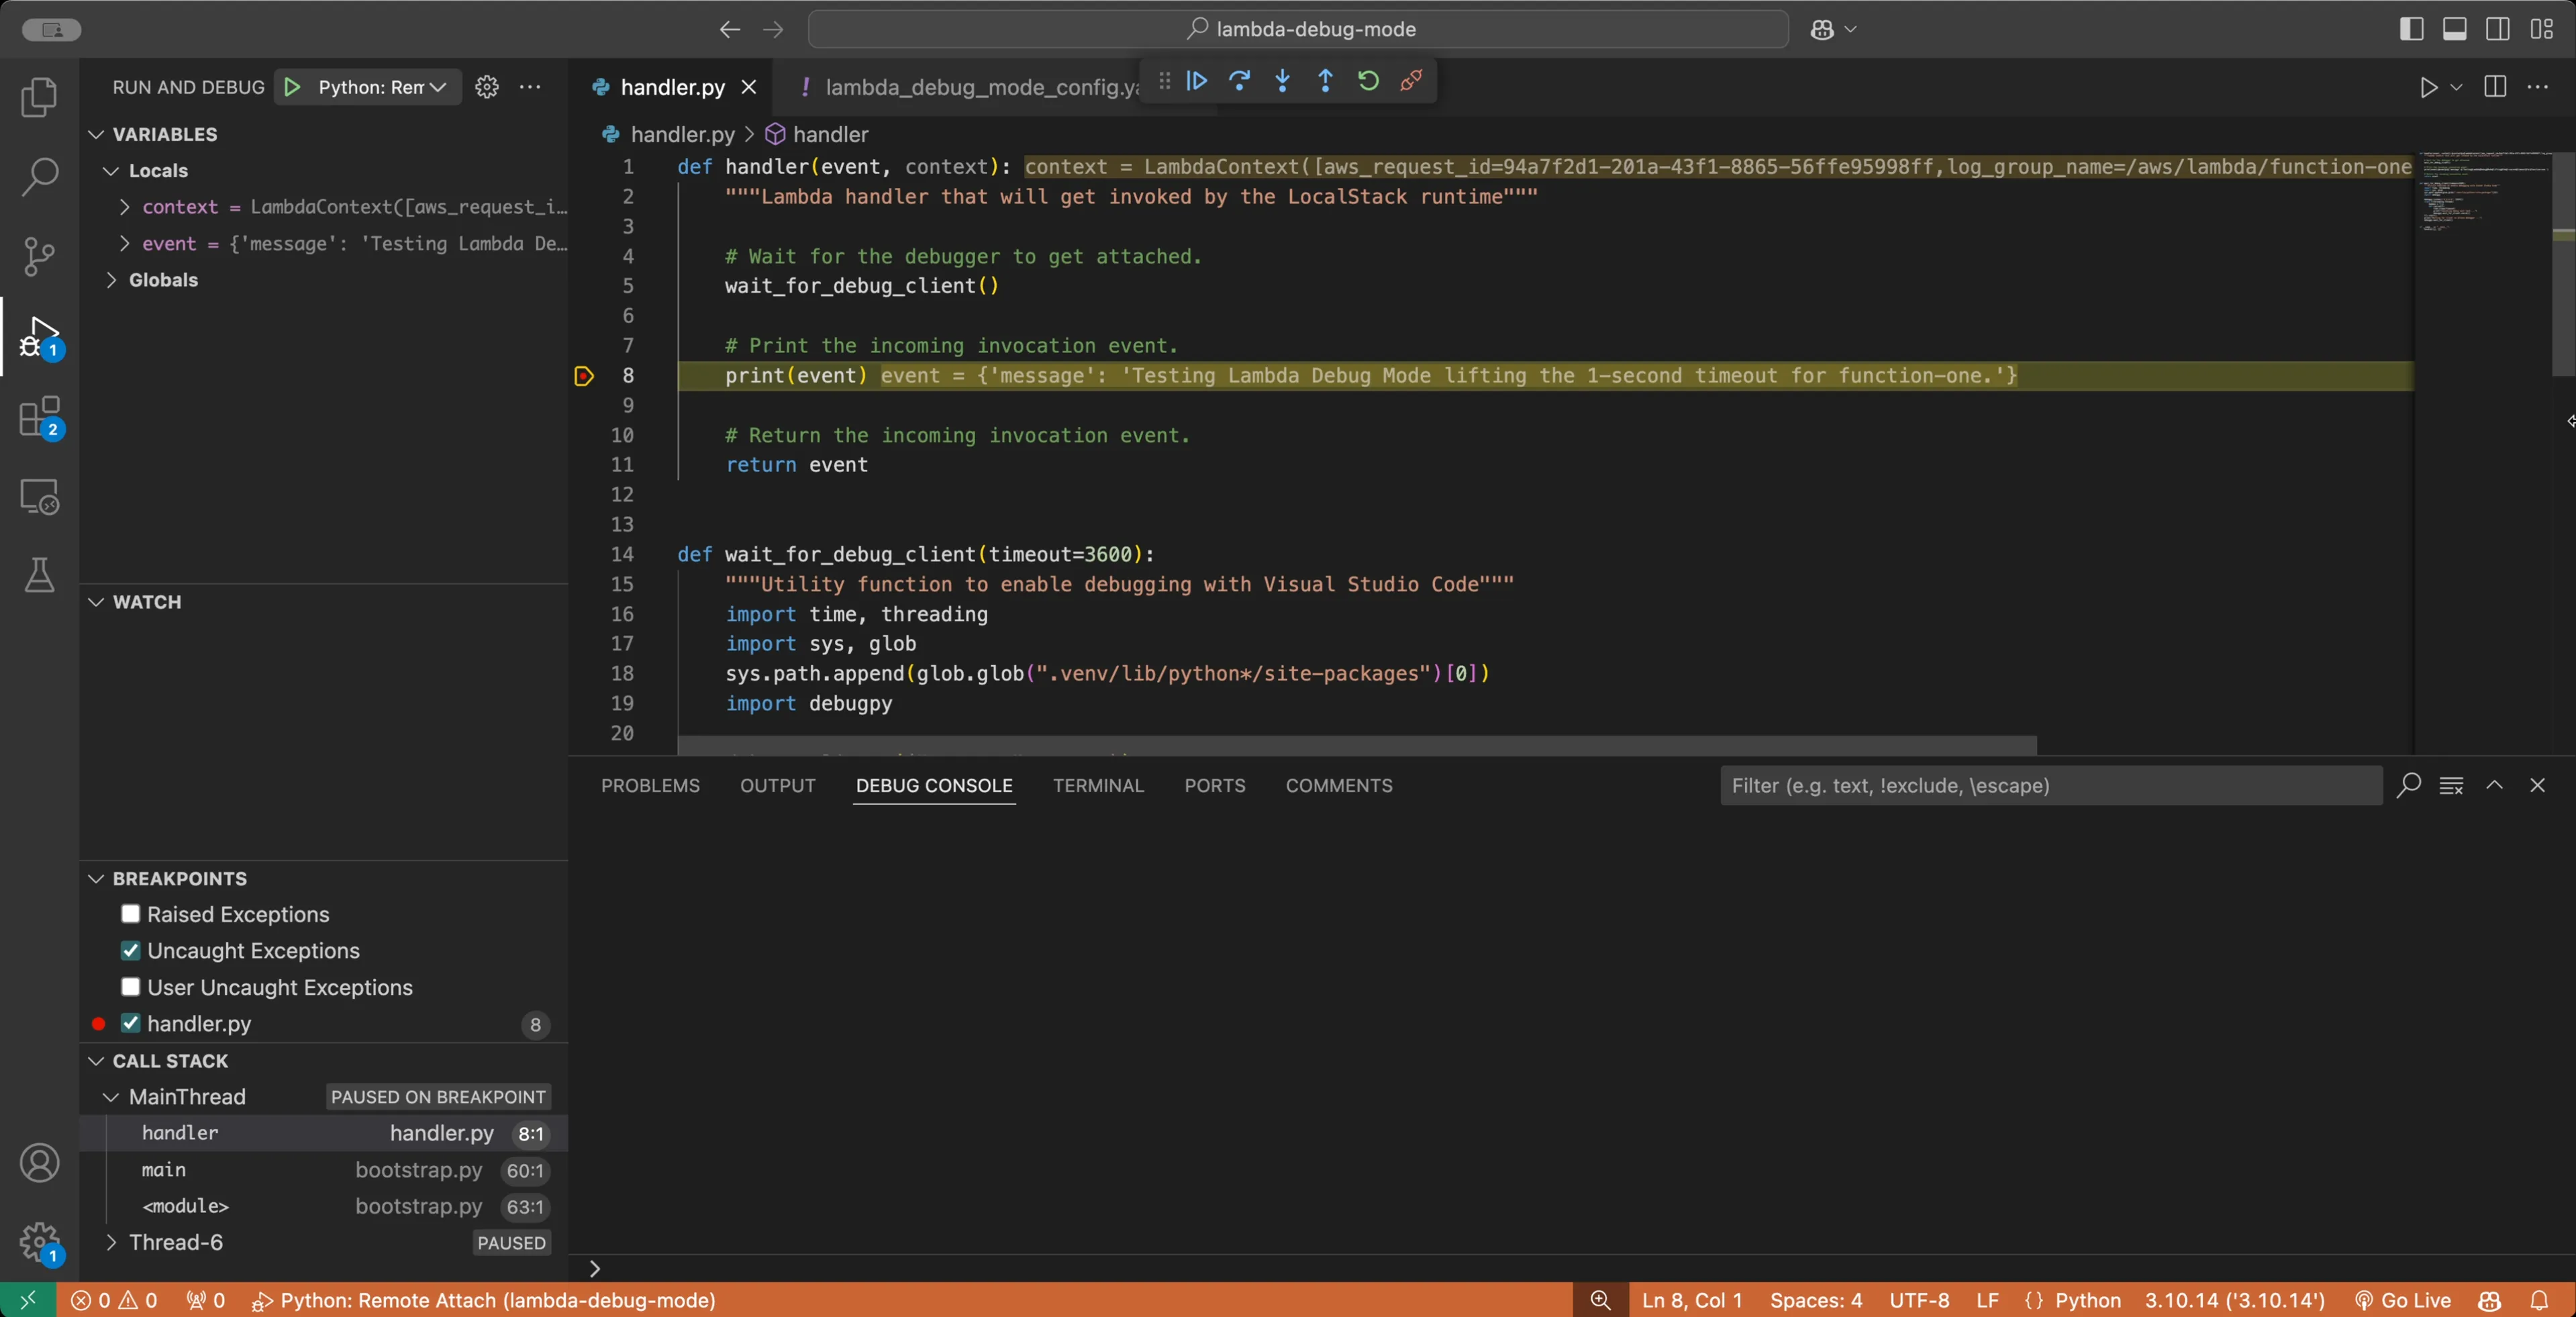
Once the Lambda is deployed, invoke it with an extended timeout to start debugging:
AWS_MAX_ATTEMPTS=1 \awslocal lambda invoke \ --cli-connect-timeout 3600 \ --cli-read-timeout 3600 \ --cli-binary-format raw-in-base64-out \ --function-name function-one \ --payload '{"message": "Testing Lambda Debug Mode lifting the 1-second timeout for function-one."}' \ /dev/stdout 2>/dev/stderrNote: The
--cli-connect-timeoutand--cli-read-timeoutflags raise AWS CLI timeouts to preventawslocalfrom timing out during debugging.
In Visual Studio Code:
- Open
handler.py. - Set a breakpoint (e.g., on
print(event)). - Go to the Run and Debug view.
- Select the Python: Remote Attach configuration.
- The remote debugger will attach, and you can step through the code.
1.6: Make changes and reload
Thanks to Hot Reload, any updates to your Lambda function will take effect immediately without redeployment. For example:
def handler(event, context): wait_for_debug_client() print(event) print("!! Additional log output !!") # New line return eventOn your next invocation, the new log message will appear in the Lambda output.
This enables a fast and flexible debug loop during development.
Debug a Lambda function with multiple concurrent invocations
In this scenario, we’ll explore how Lambda Debug Mode handles multiple invocations of the same Lambda function occurring around the same time. We’ll reuse the same function-one Lambda created in Scenario 1, which includes a one-second timeout that is automatically lifted by Debug Mode.
The goal is to observe how LocalStack behaves when the Lambda function is invoked several times in quick succession while a debugger is attached.
2.1: Invoke Lambda function multiple times
To simulate this, run the following script. It invokes the Lambda function three times, spaced five seconds apart:
for i in {1..3}; do echo "Invoking the Lambda function, attempt $i." AWS_MAX_ATTEMPTS=1 \ awslocal lambda invoke \ --cli-connect-timeout 3600 \ --cli-read-timeout 3600 \ --cli-binary-format raw-in-base64-out \ --function-name "$FUNCTION_NAME" \ --payload "{\"message\": \"Testing Lambda Debug Mode lifting the 1-second timeout for function-one. Attempt $i.\"}" \ /dev/stdout 2>/dev/stderr & sleep 5doneEach invocation uses a slightly different payload so you can distinguish them in the logs.
2.2: Debug the first invocation
While the function is being invoked, open Visual Studio Code and:
- Set a breakpoint in
handler.py. - Open the Run and Debug view.
- Select the Python: Remote Attach configuration.
- Start the debugger.
Lambda Debug Mode removes the timeout and pauses execution, giving you time to inspect the logic in your function.
What happens to other invocations?
Only the first invocation will be handled. Lambda Debug Mode enforces a limit of one active debug session per function. The remaining invocations will be rejected, and the LocalStack logs will show messages like the following:
2025-02-04T18:13:45.327  WARN --- [et.reactor-0] l.s.l.i.counting_service   : Concurrent lambda invocations disabled for 'arn:aws:lambda:us-east-1:000000000000:function:function-one:$LATEST' by Lambda Debug Mode2025-02-04T18:13:45.333  INFO --- [et.reactor-0] localstack.request.aws     : AWS lambda.Invoke => 429 (TooManyRequestsException)
2025-02-04T18:13:50.302  WARN --- [et.reactor-0] l.s.l.i.counting_service   : Concurrent lambda invocations disabled for 'arn:aws:lambda:us-east-1:000000000000:function:function-one:$LATEST' by Lambda Debug Mode2025-02-04T18:13:50.303  INFO --- [et.reactor-0] localstack.request.aws     : AWS lambda.Invoke => 429 (TooManyRequestsException)
Debug two Python Lambda functions
Real-world serverless applications often consist of multiple Lambda functions. This final scenario demonstrates how Lambda Debug Mode allows you to debug several functions concurrently during local development. We’ll configure two Python Lambda functions locally, each assigned a unique debug port.
This setup enables you to attach separate debuggers and step through the code of different functions active at the same time. LocalStack automatically lifts timeouts for both and configures their containers for debugging.
Let’s build on the setup from Scenario 1 and adapt it for a second Lambda function.
3.1: Create second Lambda function
Create a new file named handler_2.py and add the following Lambda handler:
def handler(event, context):    # Wait for the debugger to get attached.    wait_for_debug_client()
    # Print a message to log that this is handler_2.py.    print("The handler of handler_2.py is evaluating.")
    # Print the incoming invocation event.    print(event)
    # Return the incoming invocation event.    return event

def wait_for_debug_client(timeout=3600):    """Utility function to enable debugging with Visual Studio Code"""    import time, threading    import sys, glob    sys.path.append(glob.glob(".venv/lib/python*/site-packages")[0])    import debugpy
    debugpy.listen(("0.0.0.0", 19892))    class T(threading.Thread):        daemon = True        def run(self):            time.sleep(timeout)            print("Canceling debug wait task ...")            debugpy.wait_for_client.cancel()    T().start()    print("Waiting for client to attach debugger ...")    debugpy.wait_for_client()
if __name__ == "__main__":    handler({}, {})
This version mirrors the debug logic used in handler.py, with a different port (19892) for the second Lambda function.
The full source file is also available in the repository.
3.2: Update Lambda Debug Mode configuration
Open lambda_debug_mode_config.yaml and update it to define a new debug port for the second function:
functions: arn:aws:lambda:us-east-1:000000000000:function:function-one: debug-port: 19891 arn:aws:lambda:us-east-1:000000000000:function:function-two: debug-port: 19892LocalStack detects configuration file changes automatically—no restart required.
3.3: Add second debug configuration in VS Code
Update .vscode/launch.json to include a second configuration for function-two:
{ "version": "0.2.0", "configurations": [ { "name": "Python: Remote Attach to function_one", "type": "debugpy", "request": "attach", "connect": { "host": "localhost", "port": 19891 }, "pathMappings": [ { "localRoot": "${workspaceFolder}", "remoteRoot": "." } ] }, { "name": "Python: Remote Attach to function_two", "type": "debugpy", "request": "attach", "connect": { "host": "localhost", "port": 19892 }, "pathMappings": [ { "localRoot": "${workspaceFolder}", "remoteRoot": "." } ] } ]}3.4: Deploy second Lambda function
Use awslocal to create the second function, pointing to the new handler file:
awslocal lambda create-function \ --function-name function-two \ --timeout 1 \ --code "S3Bucket=hot-reload,S3Key=$(pwd)/" \ --handler handler_2.handler \ --role arn:aws:iam::000000000000:role/test-role \ --runtime python3.12Wait until the function is active:
awslocal lambda wait function-active-v2 --function-name function-two3.5: Debug second Lambda function
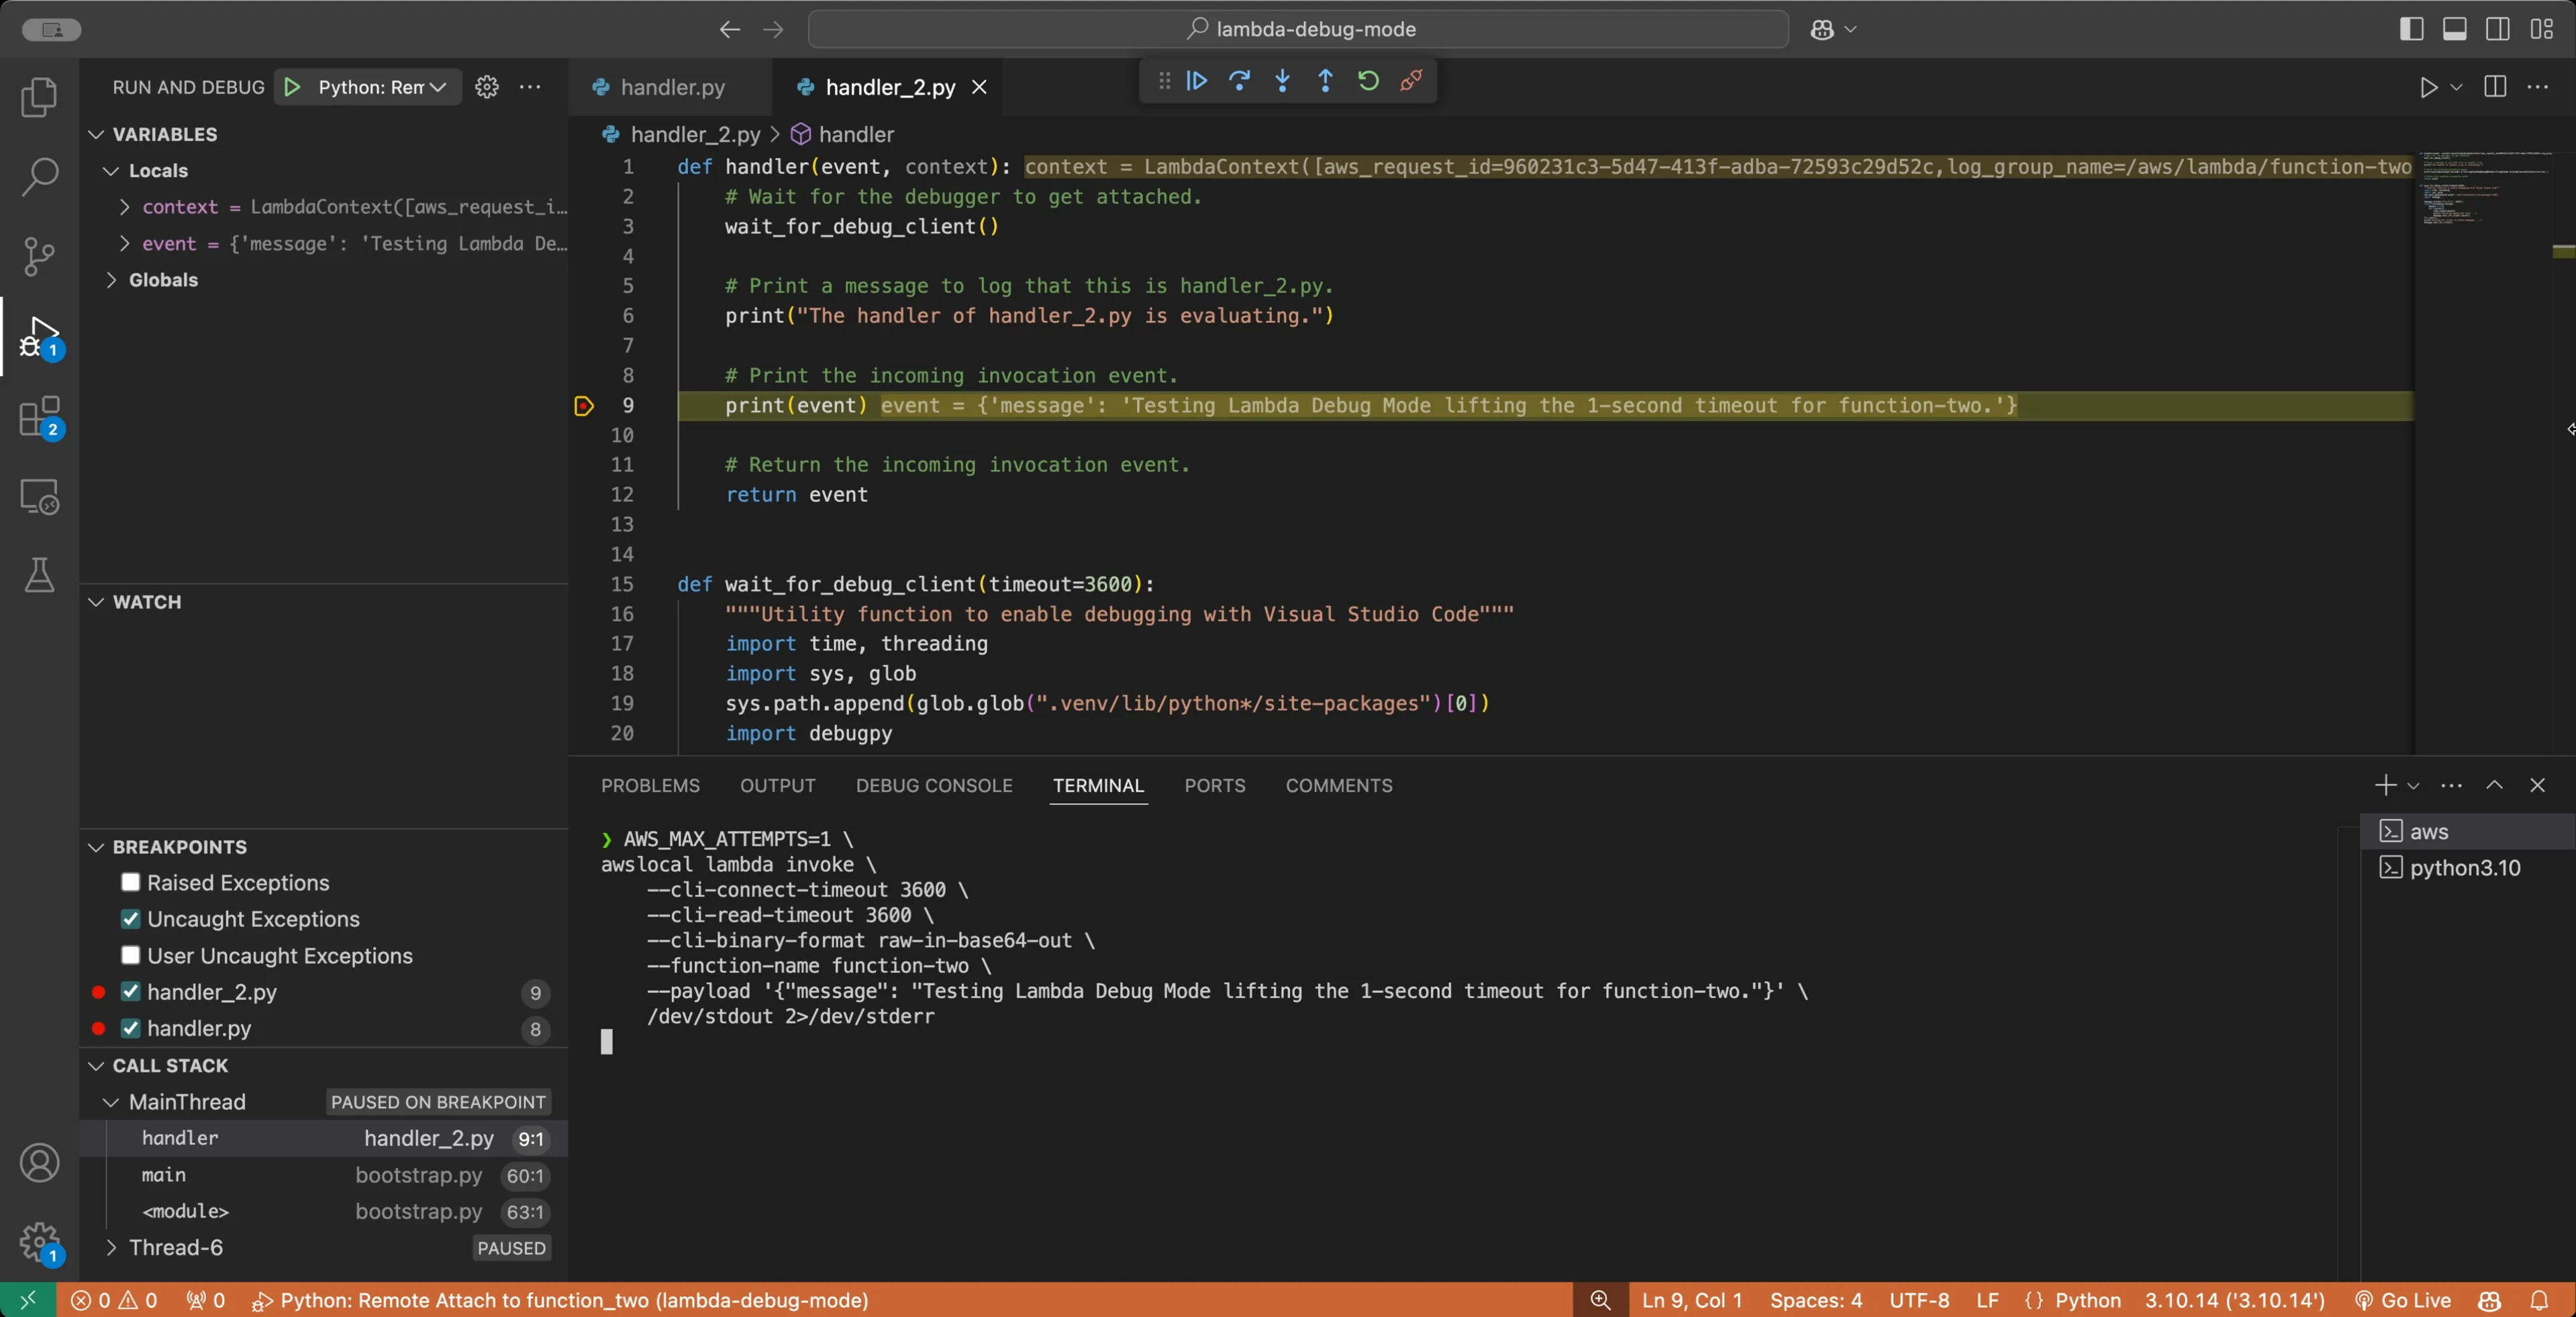
Invoke the second function and attach your debugger:
AWS_MAX_ATTEMPTS=1 \awslocal lambda invoke \ --cli-connect-timeout 3600 \ --cli-read-timeout 3600 \ --cli-binary-format raw-in-base64-out \ --function-name function-two \ --payload '{"message": "Testing Lambda Debug Mode lifting the 1-second timeout for function-two."}' \ /dev/stdout 2>/dev/stderrThen in Visual Studio Code:
- Open
handler_2.py. - Set a breakpoint (e.g., on
print(event)). - Go to the Run and Debug view.
- Select Python: Remote Attach to function_two.
- Begin debugging.
Debugging both functions simultaneously
You can also run both Lambda functions with their respective debuggers at the same time. Each function listens on a different port, and Lambda Debug Mode lifts the timeout for both, allowing simultaneous debugging sessions without conflict.
Conclusion
LocalStack’s Lambda Debug Mode simplifies local debugging for serverless workflows, offering:
- Lifted timeouts for uninterrupted debugging sessions
- Remote debugger support for single and chained Lambda functions
- Full support for event-driven triggers like SQS
Whether you’re working on simple functions or more complex event chains, you can now debug your logic locally before deploying to the cloud. That reduces friction in your development cycles, helps catch errors early, and improves confidence in your serverless applications.